British vs Indonesian Bachelor's Degree
COMPARE
British
Indonesian
Bachelor's Degree
Bachelor's Degree Comparison
British
Indonesians
40.4%
BACHELOR'S DEGREE
94.2/ 100
METRIC RATING
125th/ 347
METRIC RANK
33.5%
BACHELOR'S DEGREE
0.9/ 100
METRIC RATING
250th/ 347
METRIC RANK
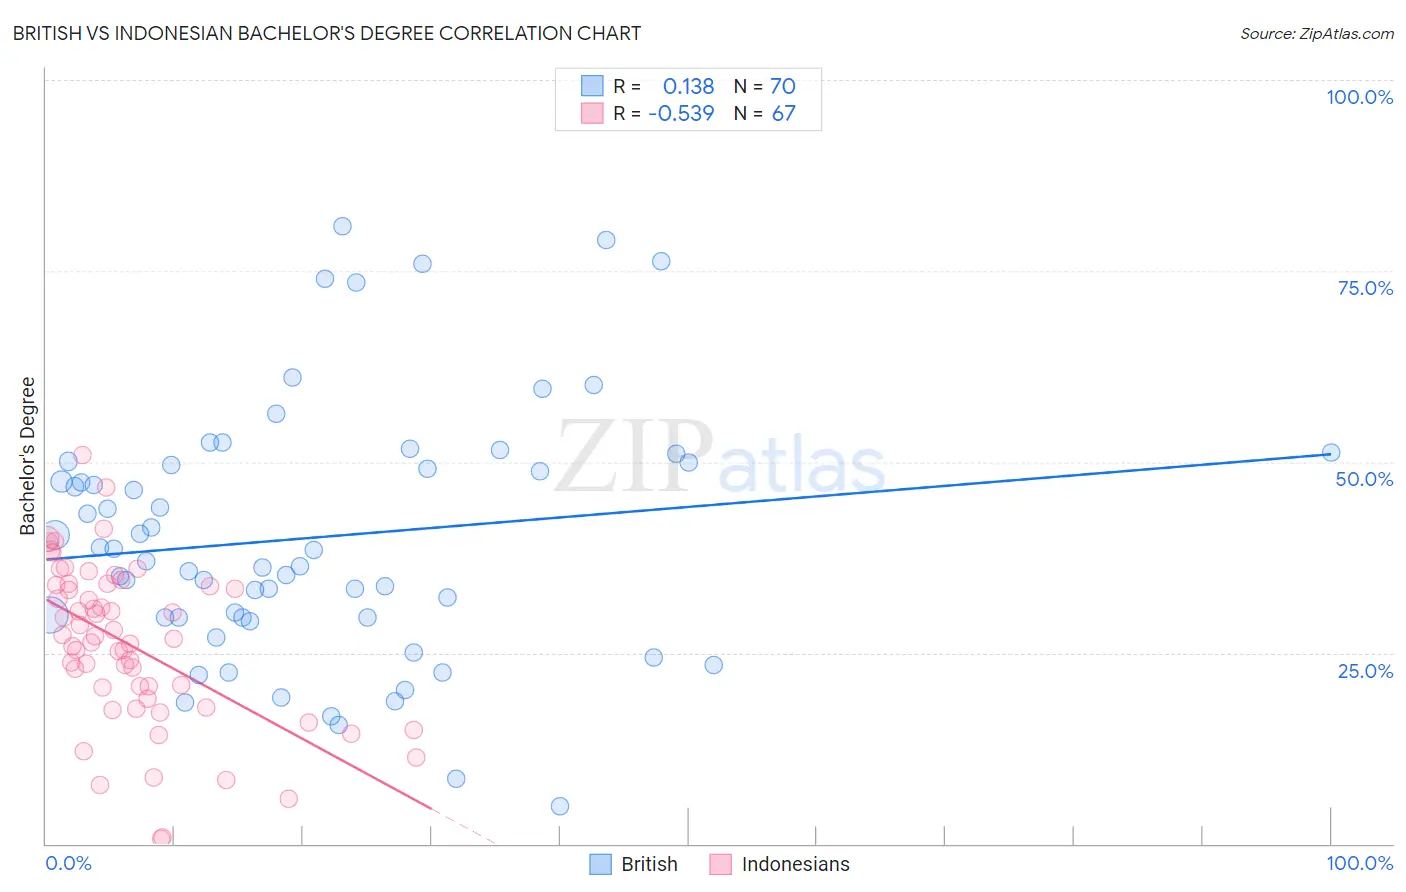
British vs Indonesian Bachelor's Degree Correlation Chart
The statistical analysis conducted on geographies consisting of 531,374,091 people shows a poor positive correlation between the proportion of British and percentage of population with at least bachelor's degree education in the United States with a correlation coefficient (R) of 0.138 and weighted average of 40.4%. Similarly, the statistical analysis conducted on geographies consisting of 162,716,505 people shows a substantial negative correlation between the proportion of Indonesians and percentage of population with at least bachelor's degree education in the United States with a correlation coefficient (R) of -0.539 and weighted average of 33.5%, a difference of 20.4%.
Bachelor's Degree Correlation Summary
| Measurement | British | Indonesian |
| Minimum | 5.0% | 0.73% |
| Maximum | 80.9% | 50.9% |
| Range | 76.0% | 50.2% |
| Mean | 40.1% | 26.1% |
| Median | 37.7% | 26.9% |
| Interquartile 25% (IQ1) | 29.6% | 19.0% |
| Interquartile 75% (IQ3) | 50.0% | 33.9% |
| Interquartile Range (IQR) | 20.4% | 14.9% |
| Standard Deviation (Sample) | 16.7% | 10.5% |
| Standard Deviation (Population) | 16.6% | 10.4% |
Similar Demographics by Bachelor's Degree
Demographics Similar to British by Bachelor's Degree
In terms of bachelor's degree, the demographic groups most similar to British are Immigrants from Eritrea (40.4%, a difference of 0.030%), Lebanese (40.4%, a difference of 0.040%), Immigrants from Eastern Africa (40.4%, a difference of 0.050%), Immigrants from Albania (40.4%, a difference of 0.060%), and Moroccan (40.5%, a difference of 0.16%).
| Demographics | Rating | Rank | Bachelor's Degree |
| Croatians | 95.5 /100 | #118 | Exceptional 40.6% |
| Immigrants | Syria | 94.9 /100 | #119 | Exceptional 40.5% |
| Venezuelans | 94.7 /100 | #120 | Exceptional 40.5% |
| Moroccans | 94.6 /100 | #121 | Exceptional 40.5% |
| Immigrants | Albania | 94.4 /100 | #122 | Exceptional 40.4% |
| Lebanese | 94.3 /100 | #123 | Exceptional 40.4% |
| Immigrants | Eritrea | 94.3 /100 | #124 | Exceptional 40.4% |
| British | 94.2 /100 | #125 | Exceptional 40.4% |
| Immigrants | Eastern Africa | 94.1 /100 | #126 | Exceptional 40.4% |
| Immigrants | Jordan | 93.4 /100 | #127 | Exceptional 40.3% |
| Immigrants | Venezuela | 92.9 /100 | #128 | Exceptional 40.2% |
| Serbians | 92.4 /100 | #129 | Exceptional 40.1% |
| Sierra Leoneans | 92.2 /100 | #130 | Exceptional 40.1% |
| Italians | 91.9 /100 | #131 | Exceptional 40.1% |
| Taiwanese | 91.1 /100 | #132 | Exceptional 40.0% |
Demographics Similar to Indonesians by Bachelor's Degree
In terms of bachelor's degree, the demographic groups most similar to Indonesians are Immigrants from Liberia (33.5%, a difference of 0.010%), Cree (33.6%, a difference of 0.13%), Immigrants from Congo (33.6%, a difference of 0.15%), Jamaican (33.6%, a difference of 0.24%), and Immigrants from Fiji (33.7%, a difference of 0.60%).
| Demographics | Rating | Rank | Bachelor's Degree |
| Immigrants | Guyana | 1.4 /100 | #243 | Tragic 33.9% |
| Delaware | 1.2 /100 | #244 | Tragic 33.8% |
| Immigrants | Fiji | 1.2 /100 | #245 | Tragic 33.7% |
| Jamaicans | 1.0 /100 | #246 | Tragic 33.6% |
| Immigrants | Congo | 1.0 /100 | #247 | Tragic 33.6% |
| Cree | 1.0 /100 | #248 | Tragic 33.6% |
| Immigrants | Liberia | 0.9 /100 | #249 | Tragic 33.5% |
| Indonesians | 0.9 /100 | #250 | Tragic 33.5% |
| Japanese | 0.7 /100 | #251 | Tragic 33.3% |
| Immigrants | Bahamas | 0.7 /100 | #252 | Tragic 33.3% |
| U.S. Virgin Islanders | 0.7 /100 | #253 | Tragic 33.2% |
| Native Hawaiians | 0.7 /100 | #254 | Tragic 33.2% |
| Iroquois | 0.7 /100 | #255 | Tragic 33.2% |
| Nicaraguans | 0.6 /100 | #256 | Tragic 33.1% |
| Spanish Americans | 0.6 /100 | #257 | Tragic 33.1% |