Aleut vs Belgian Bachelor's Degree
COMPARE
Aleut
Belgian
Bachelor's Degree
Bachelor's Degree Comparison
Aleuts
Belgians
31.3%
BACHELOR'S DEGREE
0.1/ 100
METRIC RATING
285th/ 347
METRIC RANK
37.0%
BACHELOR'S DEGREE
29.9/ 100
METRIC RATING
194th/ 347
METRIC RANK
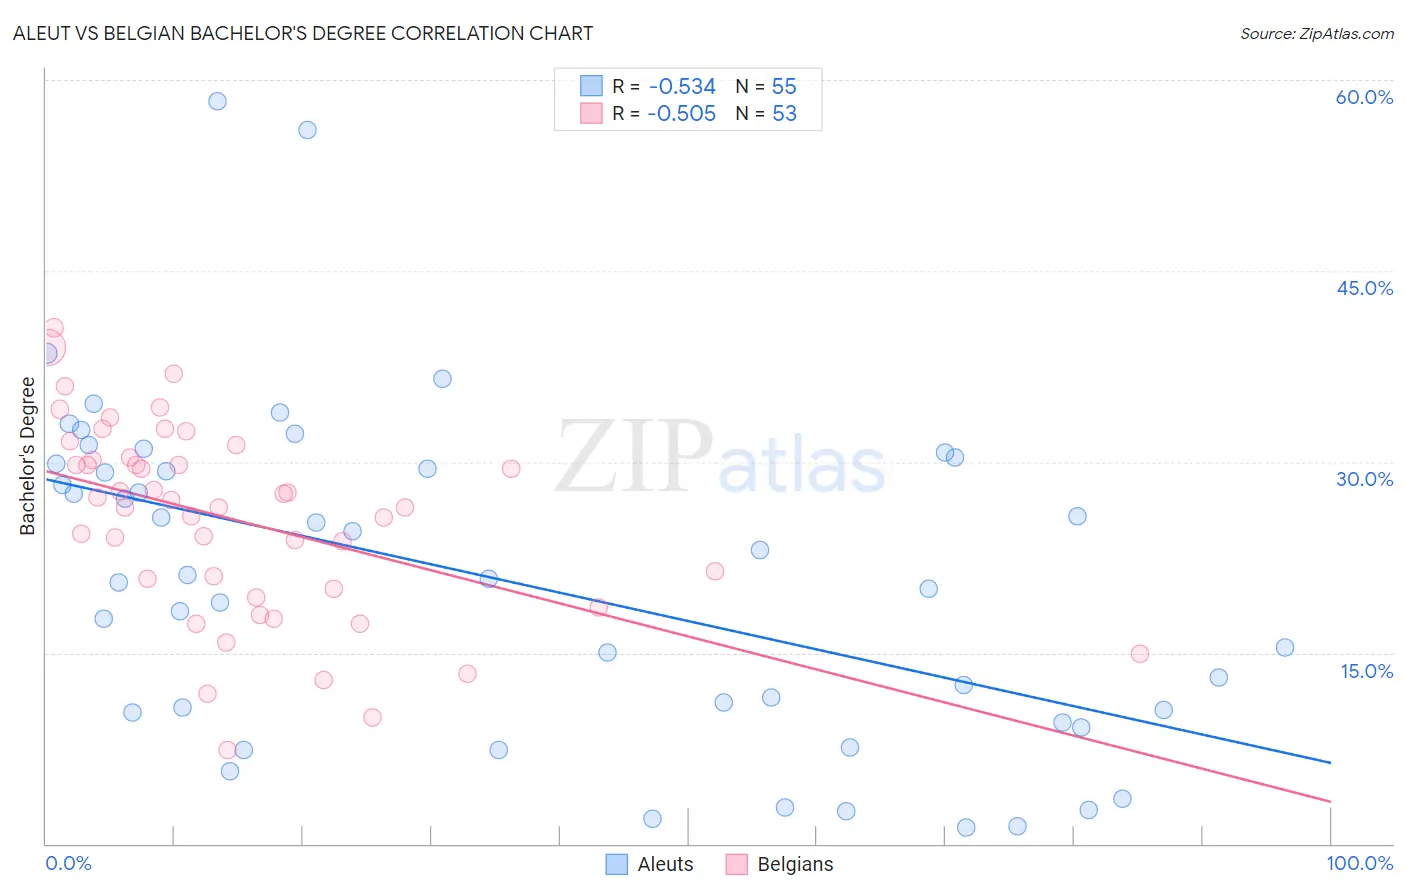
Aleut vs Belgian Bachelor's Degree Correlation Chart
The statistical analysis conducted on geographies consisting of 61,782,473 people shows a substantial negative correlation between the proportion of Aleuts and percentage of population with at least bachelor's degree education in the United States with a correlation coefficient (R) of -0.534 and weighted average of 31.3%. Similarly, the statistical analysis conducted on geographies consisting of 356,003,324 people shows a substantial negative correlation between the proportion of Belgians and percentage of population with at least bachelor's degree education in the United States with a correlation coefficient (R) of -0.505 and weighted average of 37.0%, a difference of 18.3%.
Bachelor's Degree Correlation Summary
| Measurement | Aleut | Belgian |
| Minimum | 1.3% | 7.4% |
| Maximum | 58.3% | 40.5% |
| Range | 57.1% | 33.1% |
| Mean | 20.8% | 25.4% |
| Median | 20.9% | 26.4% |
| Interquartile 25% (IQ1) | 10.3% | 19.7% |
| Interquartile 75% (IQ3) | 29.9% | 30.2% |
| Interquartile Range (IQR) | 19.5% | 10.5% |
| Standard Deviation (Sample) | 13.0% | 7.5% |
| Standard Deviation (Population) | 12.9% | 7.5% |
Similar Demographics by Bachelor's Degree
Demographics Similar to Aleuts by Bachelor's Degree
In terms of bachelor's degree, the demographic groups most similar to Aleuts are Haitian (31.3%, a difference of 0.010%), Honduran (31.3%, a difference of 0.040%), Immigrants from El Salvador (31.3%, a difference of 0.050%), Immigrants from Caribbean (31.4%, a difference of 0.32%), and Blackfeet (31.5%, a difference of 0.47%).
| Demographics | Rating | Rank | Bachelor's Degree |
| Marshallese | 0.1 /100 | #278 | Tragic 31.7% |
| Hawaiians | 0.1 /100 | #279 | Tragic 31.6% |
| Immigrants | Laos | 0.1 /100 | #280 | Tragic 31.6% |
| Blackfeet | 0.1 /100 | #281 | Tragic 31.5% |
| Immigrants | Caribbean | 0.1 /100 | #282 | Tragic 31.4% |
| Hondurans | 0.1 /100 | #283 | Tragic 31.3% |
| Haitians | 0.1 /100 | #284 | Tragic 31.3% |
| Aleuts | 0.1 /100 | #285 | Tragic 31.3% |
| Immigrants | El Salvador | 0.1 /100 | #286 | Tragic 31.3% |
| Ottawa | 0.1 /100 | #287 | Tragic 31.1% |
| Guatemalans | 0.1 /100 | #288 | Tragic 31.0% |
| Puerto Ricans | 0.1 /100 | #289 | Tragic 31.0% |
| Immigrants | Honduras | 0.1 /100 | #290 | Tragic 30.9% |
| Blacks/African Americans | 0.1 /100 | #291 | Tragic 30.9% |
| Ute | 0.1 /100 | #292 | Tragic 30.9% |
Demographics Similar to Belgians by Bachelor's Degree
In terms of bachelor's degree, the demographic groups most similar to Belgians are Korean (37.0%, a difference of 0.010%), Celtic (37.0%, a difference of 0.040%), Czechoslovakian (37.0%, a difference of 0.090%), Welsh (37.0%, a difference of 0.10%), and Yugoslavian (37.1%, a difference of 0.19%).
| Demographics | Rating | Rank | Bachelor's Degree |
| English | 39.7 /100 | #187 | Fair 37.4% |
| Immigrants | Oceania | 37.3 /100 | #188 | Fair 37.3% |
| Slovaks | 36.9 /100 | #189 | Fair 37.3% |
| Swiss | 34.1 /100 | #190 | Fair 37.2% |
| Nigerians | 33.9 /100 | #191 | Fair 37.2% |
| Immigrants | Vietnam | 32.1 /100 | #192 | Fair 37.1% |
| Yugoslavians | 31.5 /100 | #193 | Fair 37.1% |
| Belgians | 29.9 /100 | #194 | Fair 37.0% |
| Koreans | 29.8 /100 | #195 | Fair 37.0% |
| Celtics | 29.5 /100 | #196 | Fair 37.0% |
| Czechoslovakians | 29.2 /100 | #197 | Fair 37.0% |
| Welsh | 29.1 /100 | #198 | Fair 37.0% |
| Immigrants | Costa Rica | 27.4 /100 | #199 | Fair 36.9% |
| Immigrants | Ghana | 27.4 /100 | #200 | Fair 36.9% |
| Immigrants | South Eastern Asia | 25.4 /100 | #201 | Fair 36.8% |