Aleut vs Indonesian Disability Age 35 to 64
COMPARE
Aleut
Indonesian
Disability Age 35 to 64
Disability Age 35 to 64 Comparison
Aleuts
Indonesians
13.8%
DISABILITY AGE 35 TO 64
0.0/ 100
METRIC RATING
302nd/ 347
METRIC RANK
13.2%
DISABILITY AGE 35 TO 64
0.0/ 100
METRIC RATING
289th/ 347
METRIC RANK
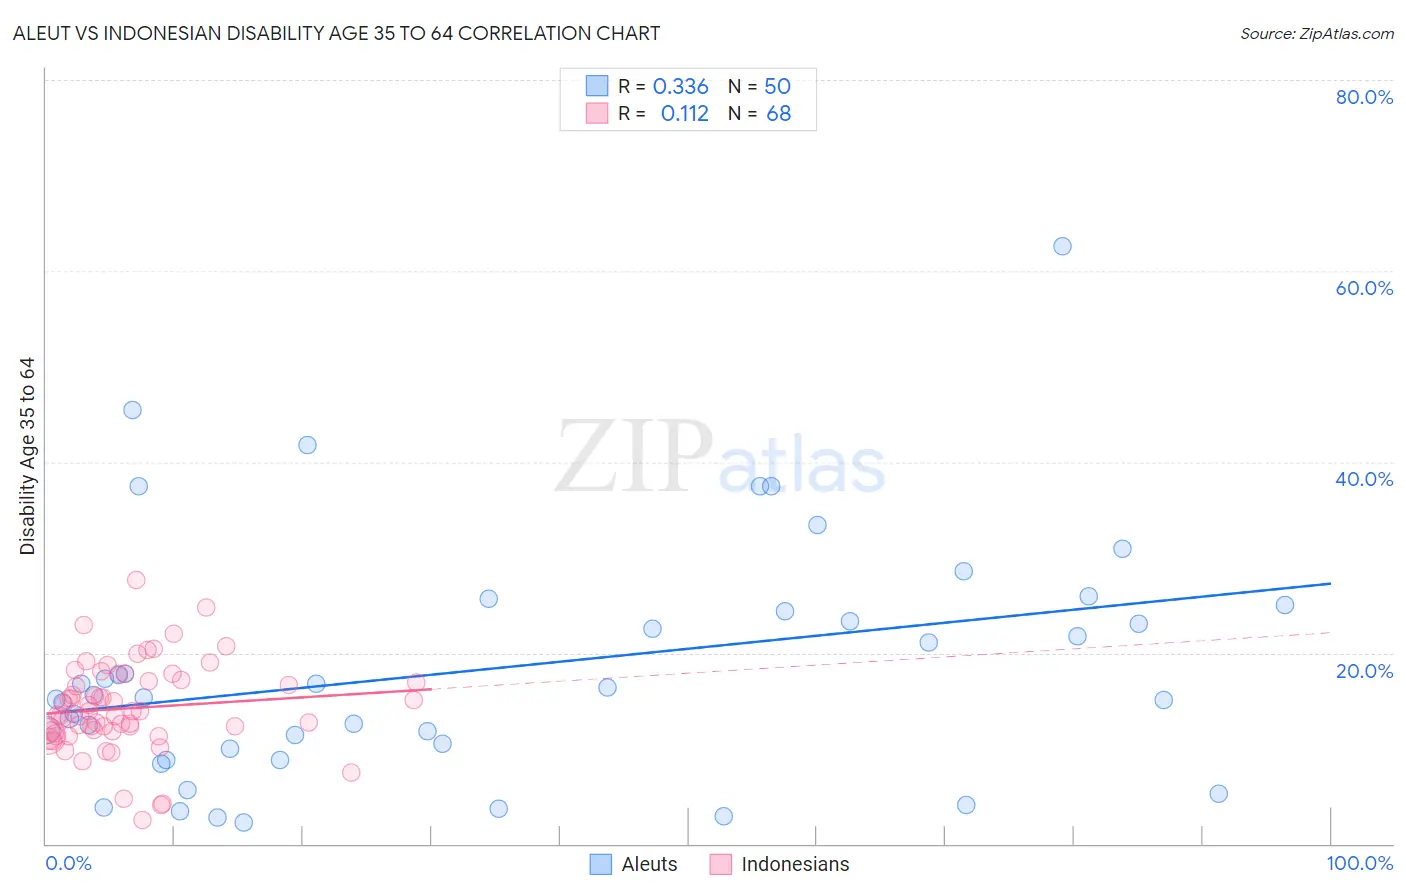
Aleut vs Indonesian Disability Age 35 to 64 Correlation Chart
The statistical analysis conducted on geographies consisting of 61,774,643 people shows a mild positive correlation between the proportion of Aleuts and percentage of population with a disability between the ages 34 and 64 in the United States with a correlation coefficient (R) of 0.336 and weighted average of 13.8%. Similarly, the statistical analysis conducted on geographies consisting of 162,649,363 people shows a poor positive correlation between the proportion of Indonesians and percentage of population with a disability between the ages 34 and 64 in the United States with a correlation coefficient (R) of 0.112 and weighted average of 13.2%, a difference of 4.5%.
Disability Age 35 to 64 Correlation Summary
| Measurement | Aleut | Indonesian |
| Minimum | 2.2% | 2.5% |
| Maximum | 62.6% | 27.6% |
| Range | 60.4% | 25.1% |
| Mean | 18.3% | 14.2% |
| Median | 15.4% | 13.7% |
| Interquartile 25% (IQ1) | 9.9% | 11.6% |
| Interquartile 75% (IQ3) | 24.4% | 17.1% |
| Interquartile Range (IQR) | 14.5% | 5.5% |
| Standard Deviation (Sample) | 12.6% | 4.7% |
| Standard Deviation (Population) | 12.5% | 4.6% |
Demographics Similar to Aleuts and Indonesians by Disability Age 35 to 64
In terms of disability age 35 to 64, the demographic groups most similar to Aleuts are Sioux (13.9%, a difference of 0.18%), Hopi (13.9%, a difference of 0.21%), American (13.9%, a difference of 0.59%), French American Indian (13.7%, a difference of 0.89%), and Delaware (13.7%, a difference of 1.2%). Similarly, the demographic groups most similar to Indonesians are Fijian (13.2%, a difference of 0.070%), Immigrants from Liberia (13.2%, a difference of 0.080%), Tlingit-Haida (13.2%, a difference of 0.42%), Immigrants from Congo (13.3%, a difference of 0.59%), and Puget Sound Salish (13.3%, a difference of 0.64%).
| Demographics | Rating | Rank | Disability Age 35 to 64 |
| Immigrants | Somalia | 0.0 /100 | #285 | Tragic 13.1% |
| Hmong | 0.0 /100 | #286 | Tragic 13.1% |
| Tlingit-Haida | 0.0 /100 | #287 | Tragic 13.2% |
| Fijians | 0.0 /100 | #288 | Tragic 13.2% |
| Indonesians | 0.0 /100 | #289 | Tragic 13.2% |
| Immigrants | Liberia | 0.0 /100 | #290 | Tragic 13.2% |
| Immigrants | Congo | 0.0 /100 | #291 | Tragic 13.3% |
| Puget Sound Salish | 0.0 /100 | #292 | Tragic 13.3% |
| Ute | 0.0 /100 | #293 | Tragic 13.4% |
| Yaqui | 0.0 /100 | #294 | Tragic 13.5% |
| Yakama | 0.0 /100 | #295 | Tragic 13.6% |
| Africans | 0.0 /100 | #296 | Tragic 13.6% |
| Bangladeshis | 0.0 /100 | #297 | Tragic 13.6% |
| Cheyenne | 0.0 /100 | #298 | Tragic 13.6% |
| Spanish Americans | 0.0 /100 | #299 | Tragic 13.7% |
| Delaware | 0.0 /100 | #300 | Tragic 13.7% |
| French American Indians | 0.0 /100 | #301 | Tragic 13.7% |
| Aleuts | 0.0 /100 | #302 | Tragic 13.8% |
| Sioux | 0.0 /100 | #303 | Tragic 13.9% |
| Hopi | 0.0 /100 | #304 | Tragic 13.9% |
| Americans | 0.0 /100 | #305 | Tragic 13.9% |