Immigrants from South Eastern Asia vs Immigrants from Sweden 9th Grade
COMPARE
Immigrants from South Eastern Asia
Immigrants from Sweden
9th Grade
9th Grade Comparison
Immigrants from South Eastern Asia
Immigrants from Sweden
93.3%
9TH GRADE
0.0/ 100
METRIC RATING
288th/ 347
METRIC RANK
95.8%
9TH GRADE
99.5/ 100
METRIC RATING
76th/ 347
METRIC RANK
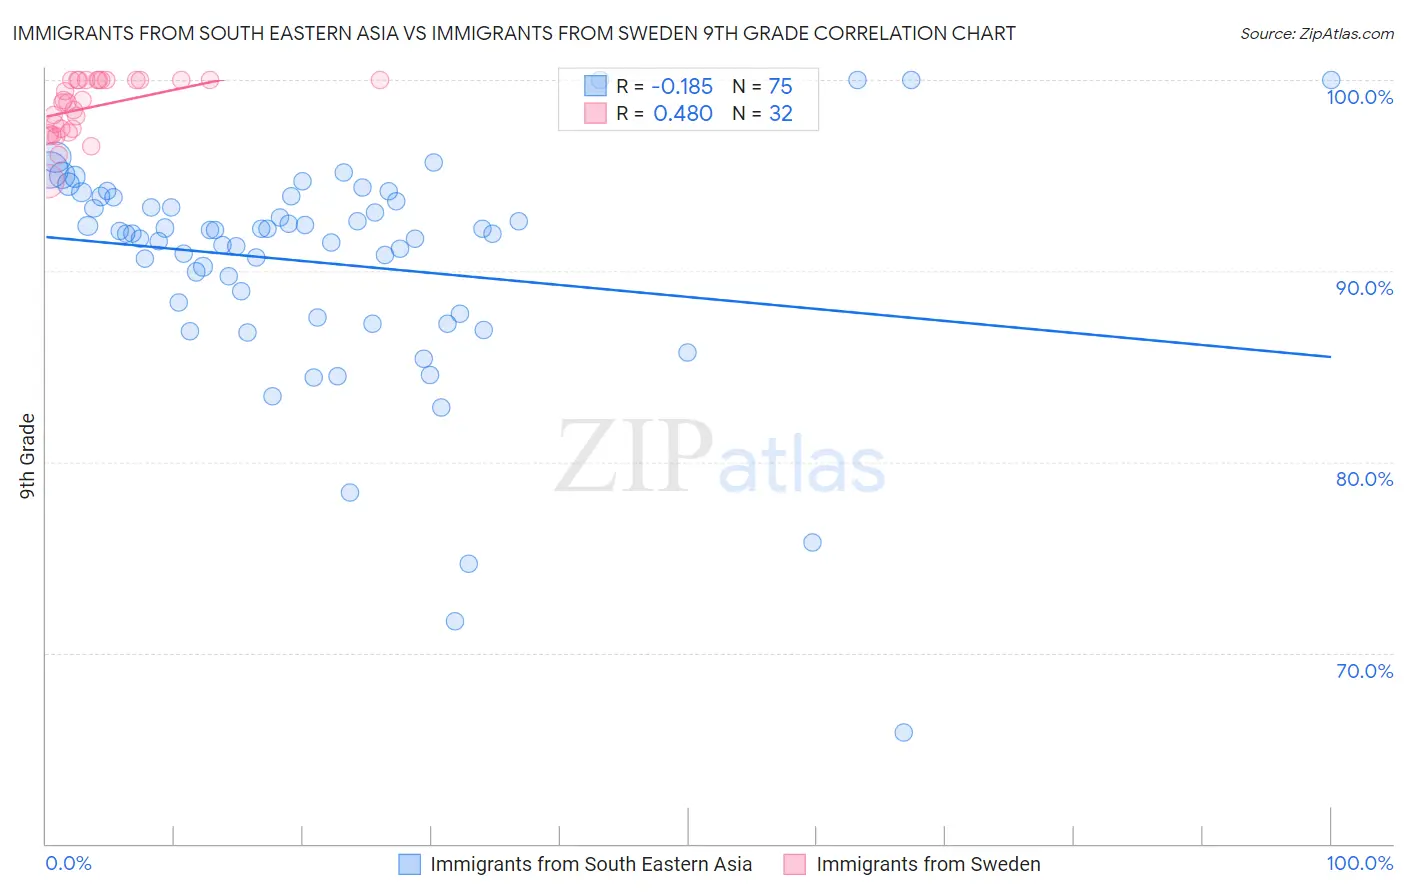
Immigrants from South Eastern Asia vs Immigrants from Sweden 9th Grade Correlation Chart
The statistical analysis conducted on geographies consisting of 512,709,822 people shows a poor negative correlation between the proportion of Immigrants from South Eastern Asia and percentage of population with at least 9th grade education in the United States with a correlation coefficient (R) of -0.185 and weighted average of 93.3%. Similarly, the statistical analysis conducted on geographies consisting of 164,736,894 people shows a moderate positive correlation between the proportion of Immigrants from Sweden and percentage of population with at least 9th grade education in the United States with a correlation coefficient (R) of 0.480 and weighted average of 95.8%, a difference of 2.6%.
9th Grade Correlation Summary
| Measurement | Immigrants from South Eastern Asia | Immigrants from Sweden |
| Minimum | 65.9% | 94.7% |
| Maximum | 100.0% | 100.0% |
| Range | 34.1% | 5.3% |
| Mean | 90.4% | 98.6% |
| Median | 92.0% | 98.9% |
| Interquartile 25% (IQ1) | 87.8% | 97.3% |
| Interquartile 75% (IQ3) | 93.9% | 100.0% |
| Interquartile Range (IQR) | 6.1% | 2.7% |
| Standard Deviation (Sample) | 6.0% | 1.5% |
| Standard Deviation (Population) | 5.9% | 1.5% |
Similar Demographics by 9th Grade
Demographics Similar to Immigrants from South Eastern Asia by 9th Grade
In terms of 9th grade, the demographic groups most similar to Immigrants from South Eastern Asia are Immigrants from St. Vincent and the Grenadines (93.4%, a difference of 0.030%), Immigrants from Barbados (93.4%, a difference of 0.040%), Immigrants from West Indies (93.3%, a difference of 0.060%), Immigrants from Peru (93.4%, a difference of 0.070%), and Pennsylvania German (93.3%, a difference of 0.070%).
| Demographics | Rating | Rank | 9th Grade |
| Immigrants | Trinidad and Tobago | 0.1 /100 | #281 | Tragic 93.6% |
| Malaysians | 0.0 /100 | #282 | Tragic 93.5% |
| Barbadians | 0.0 /100 | #283 | Tragic 93.5% |
| Bangladeshis | 0.0 /100 | #284 | Tragic 93.4% |
| Immigrants | Peru | 0.0 /100 | #285 | Tragic 93.4% |
| Immigrants | Barbados | 0.0 /100 | #286 | Tragic 93.4% |
| Immigrants | St. Vincent and the Grenadines | 0.0 /100 | #287 | Tragic 93.4% |
| Immigrants | South Eastern Asia | 0.0 /100 | #288 | Tragic 93.3% |
| Immigrants | West Indies | 0.0 /100 | #289 | Tragic 93.3% |
| Pennsylvania Germans | 0.0 /100 | #290 | Tragic 93.3% |
| British West Indians | 0.0 /100 | #291 | Tragic 93.2% |
| Immigrants | Laos | 0.0 /100 | #292 | Tragic 93.2% |
| Sri Lankans | 0.0 /100 | #293 | Tragic 93.2% |
| Cubans | 0.0 /100 | #294 | Tragic 93.2% |
| Immigrants | Burma/Myanmar | 0.0 /100 | #295 | Tragic 93.1% |
Demographics Similar to Immigrants from Sweden by 9th Grade
In terms of 9th grade, the demographic groups most similar to Immigrants from Sweden are Inupiat (95.8%, a difference of 0.010%), White/Caucasian (95.8%, a difference of 0.010%), Immigrants from South Africa (95.8%, a difference of 0.010%), Immigrants from Singapore (95.8%, a difference of 0.020%), and Thai (95.8%, a difference of 0.020%).
| Demographics | Rating | Rank | 9th Grade |
| Immigrants | Lithuania | 99.6 /100 | #69 | Exceptional 95.8% |
| Immigrants | Australia | 99.5 /100 | #70 | Exceptional 95.8% |
| Immigrants | Belgium | 99.5 /100 | #71 | Exceptional 95.8% |
| Turks | 99.5 /100 | #72 | Exceptional 95.8% |
| Immigrants | Singapore | 99.5 /100 | #73 | Exceptional 95.8% |
| Thais | 99.5 /100 | #74 | Exceptional 95.8% |
| Inupiat | 99.5 /100 | #75 | Exceptional 95.8% |
| Immigrants | Sweden | 99.5 /100 | #76 | Exceptional 95.8% |
| Whites/Caucasians | 99.4 /100 | #77 | Exceptional 95.8% |
| Immigrants | South Africa | 99.4 /100 | #78 | Exceptional 95.8% |
| Romanians | 99.3 /100 | #79 | Exceptional 95.7% |
| Bhutanese | 99.3 /100 | #80 | Exceptional 95.7% |
| Arapaho | 99.3 /100 | #81 | Exceptional 95.7% |
| Puget Sound Salish | 99.2 /100 | #82 | Exceptional 95.7% |
| Swiss | 99.2 /100 | #83 | Exceptional 95.7% |