Aleut vs Immigrants from the Azores 7th Grade
COMPARE
Aleut
Immigrants from the Azores
7th Grade
7th Grade Comparison
Aleuts
Immigrants from the Azores
97.1%
7TH GRADE
99.9/ 100
METRIC RATING
46th/ 347
METRIC RANK
93.0%
7TH GRADE
0.0/ 100
METRIC RATING
329th/ 347
METRIC RANK
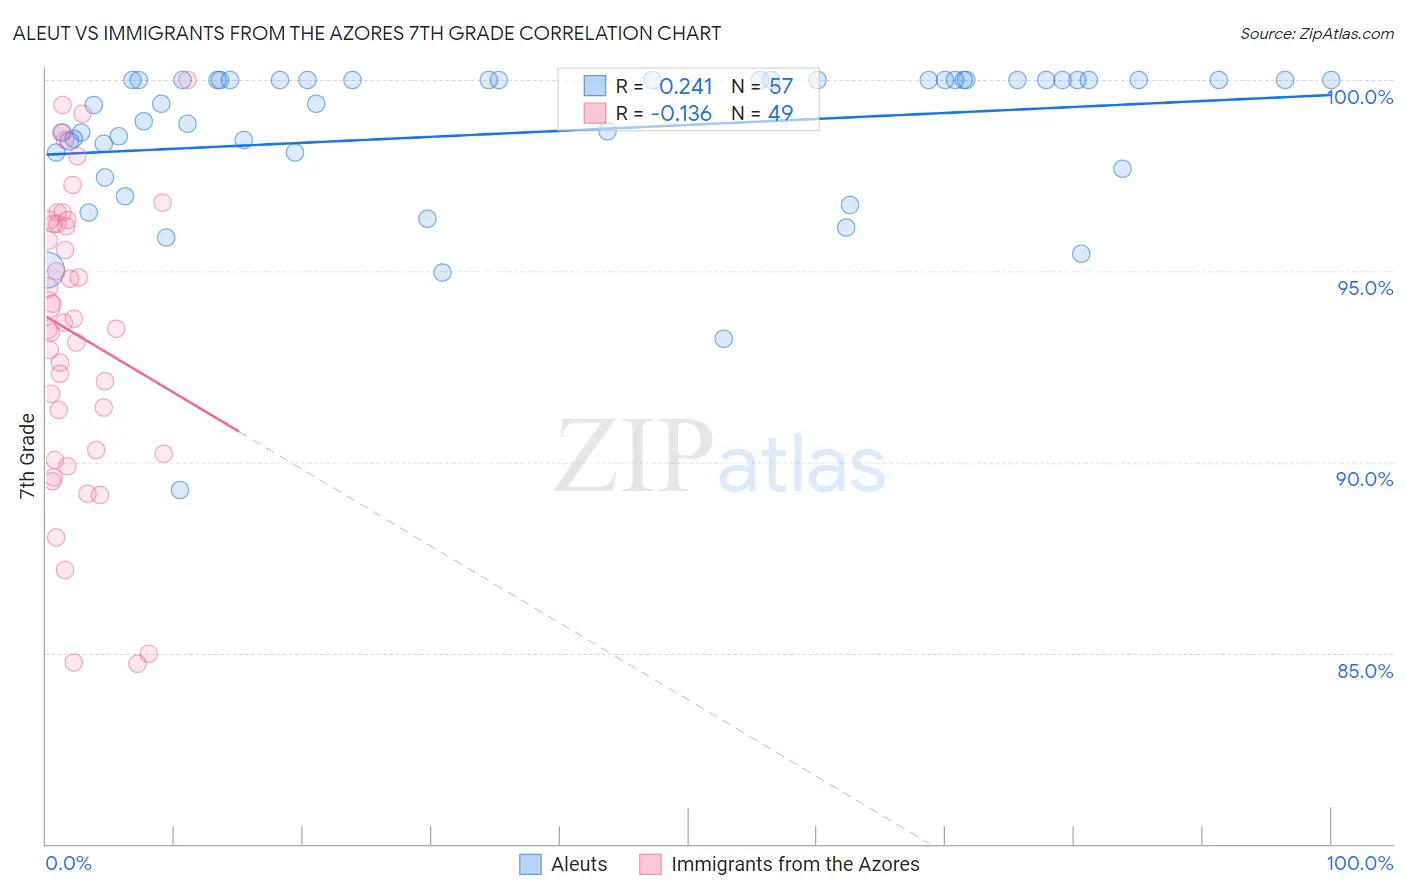
Aleut vs Immigrants from the Azores 7th Grade Correlation Chart
The statistical analysis conducted on geographies consisting of 61,782,786 people shows a weak positive correlation between the proportion of Aleuts and percentage of population with at least 7th grade education in the United States with a correlation coefficient (R) of 0.241 and weighted average of 97.1%. Similarly, the statistical analysis conducted on geographies consisting of 46,257,310 people shows a poor negative correlation between the proportion of Immigrants from the Azores and percentage of population with at least 7th grade education in the United States with a correlation coefficient (R) of -0.136 and weighted average of 93.0%, a difference of 4.4%.
7th Grade Correlation Summary
| Measurement | Aleut | Immigrants from the Azores |
| Minimum | 89.3% | 84.7% |
| Maximum | 100.0% | 100.0% |
| Range | 10.7% | 15.3% |
| Mean | 98.6% | 93.3% |
| Median | 100.0% | 93.7% |
| Interquartile 25% (IQ1) | 98.1% | 90.3% |
| Interquartile 75% (IQ3) | 100.0% | 96.3% |
| Interquartile Range (IQR) | 1.9% | 6.0% |
| Standard Deviation (Sample) | 2.1% | 3.8% |
| Standard Deviation (Population) | 2.1% | 3.8% |
Similar Demographics by 7th Grade
Demographics Similar to Aleuts by 7th Grade
In terms of 7th grade, the demographic groups most similar to Aleuts are Czechoslovakian (97.1%, a difference of 0.0%), Maltese (97.1%, a difference of 0.010%), Northern European (97.1%, a difference of 0.010%), Bulgarian (97.1%, a difference of 0.020%), and Celtic (97.1%, a difference of 0.030%).
| Demographics | Rating | Rank | 7th Grade |
| Latvians | 100.0 /100 | #39 | Exceptional 97.2% |
| Luxembourgers | 100.0 /100 | #40 | Exceptional 97.2% |
| Eastern Europeans | 100.0 /100 | #41 | Exceptional 97.2% |
| Chinese | 99.9 /100 | #42 | Exceptional 97.1% |
| Maltese | 99.9 /100 | #43 | Exceptional 97.1% |
| Northern Europeans | 99.9 /100 | #44 | Exceptional 97.1% |
| Czechoslovakians | 99.9 /100 | #45 | Exceptional 97.1% |
| Aleuts | 99.9 /100 | #46 | Exceptional 97.1% |
| Bulgarians | 99.9 /100 | #47 | Exceptional 97.1% |
| Celtics | 99.9 /100 | #48 | Exceptional 97.1% |
| Slavs | 99.9 /100 | #49 | Exceptional 97.1% |
| Immigrants | Scotland | 99.9 /100 | #50 | Exceptional 97.1% |
| Estonians | 99.9 /100 | #51 | Exceptional 97.0% |
| Greeks | 99.9 /100 | #52 | Exceptional 97.0% |
| Austrians | 99.8 /100 | #53 | Exceptional 97.0% |
Demographics Similar to Immigrants from the Azores by 7th Grade
In terms of 7th grade, the demographic groups most similar to Immigrants from the Azores are Immigrants from Nicaragua (93.0%, a difference of 0.040%), Immigrants from Dominican Republic (92.9%, a difference of 0.050%), Honduran (92.9%, a difference of 0.090%), Immigrants from Cabo Verde (93.1%, a difference of 0.17%), and Hispanic or Latino (92.7%, a difference of 0.23%).
| Demographics | Rating | Rank | 7th Grade |
| Nicaraguans | 0.0 /100 | #322 | Tragic 93.5% |
| Immigrants | Belize | 0.0 /100 | #323 | Tragic 93.4% |
| Dominicans | 0.0 /100 | #324 | Tragic 93.3% |
| Central American Indians | 0.0 /100 | #325 | Tragic 93.3% |
| Nepalese | 0.0 /100 | #326 | Tragic 93.2% |
| Immigrants | Cabo Verde | 0.0 /100 | #327 | Tragic 93.1% |
| Immigrants | Nicaragua | 0.0 /100 | #328 | Tragic 93.0% |
| Immigrants | Azores | 0.0 /100 | #329 | Tragic 93.0% |
| Immigrants | Dominican Republic | 0.0 /100 | #330 | Tragic 92.9% |
| Hondurans | 0.0 /100 | #331 | Tragic 92.9% |
| Hispanics or Latinos | 0.0 /100 | #332 | Tragic 92.7% |
| Immigrants | Armenia | 0.0 /100 | #333 | Tragic 92.7% |
| Immigrants | Yemen | 0.0 /100 | #334 | Tragic 92.6% |
| Mexican American Indians | 0.0 /100 | #335 | Tragic 92.6% |
| Immigrants | Honduras | 0.0 /100 | #336 | Tragic 92.5% |