Immigrants from Eritrea vs African 2nd Grade
COMPARE
Immigrants from Eritrea
African
2nd Grade
2nd Grade Comparison
Immigrants from Eritrea
Africans
97.2%
2ND GRADE
0.0/ 100
METRIC RATING
292nd/ 347
METRIC RANK
97.7%
2ND GRADE
15.6/ 100
METRIC RATING
207th/ 347
METRIC RANK
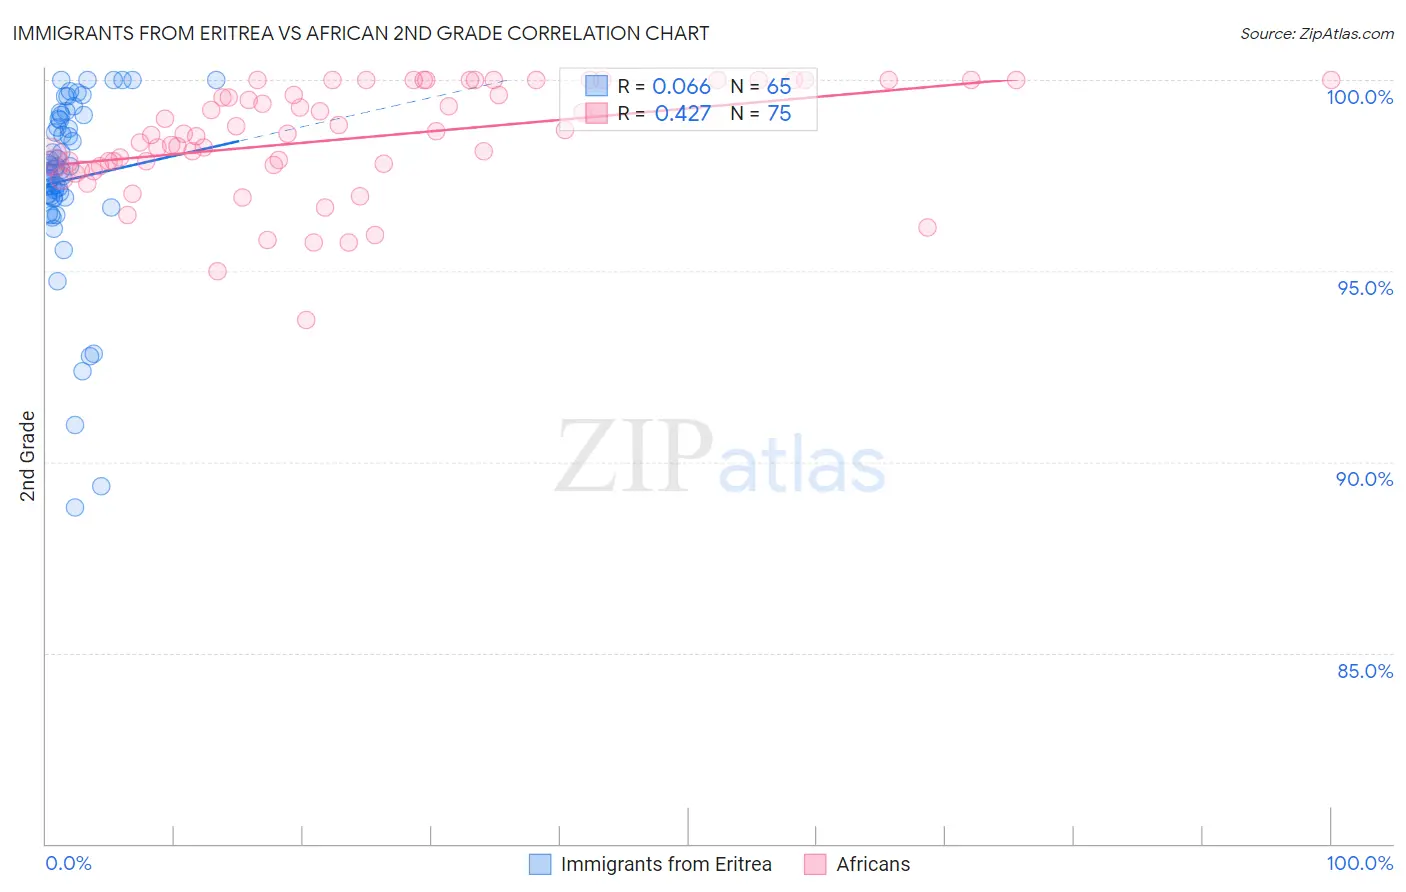
Immigrants from Eritrea vs African 2nd Grade Correlation Chart
The statistical analysis conducted on geographies consisting of 104,801,381 people shows a slight positive correlation between the proportion of Immigrants from Eritrea and percentage of population with at least 2nd grade education in the United States with a correlation coefficient (R) of 0.066 and weighted average of 97.2%. Similarly, the statistical analysis conducted on geographies consisting of 470,094,148 people shows a moderate positive correlation between the proportion of Africans and percentage of population with at least 2nd grade education in the United States with a correlation coefficient (R) of 0.427 and weighted average of 97.7%, a difference of 0.58%.
2nd Grade Correlation Summary
| Measurement | Immigrants from Eritrea | African |
| Minimum | 88.8% | 93.7% |
| Maximum | 100.0% | 100.0% |
| Range | 11.2% | 6.3% |
| Mean | 97.4% | 98.5% |
| Median | 97.7% | 98.6% |
| Interquartile 25% (IQ1) | 96.9% | 97.8% |
| Interquartile 75% (IQ3) | 99.0% | 100.0% |
| Interquartile Range (IQR) | 2.1% | 2.2% |
| Standard Deviation (Sample) | 2.4% | 1.4% |
| Standard Deviation (Population) | 2.4% | 1.4% |
Similar Demographics by 2nd Grade
Demographics Similar to Immigrants from Eritrea by 2nd Grade
In terms of 2nd grade, the demographic groups most similar to Immigrants from Eritrea are British West Indian (97.2%, a difference of 0.010%), Immigrants from Afghanistan (97.2%, a difference of 0.020%), Houma (97.2%, a difference of 0.030%), Immigrants from St. Vincent and the Grenadines (97.2%, a difference of 0.030%), and Malaysian (97.1%, a difference of 0.040%).
| Demographics | Rating | Rank | 2nd Grade |
| Immigrants | Hong Kong | 0.0 /100 | #285 | Tragic 97.2% |
| Immigrants | Barbados | 0.0 /100 | #286 | Tragic 97.2% |
| Immigrants | Portugal | 0.0 /100 | #287 | Tragic 97.2% |
| Immigrants | Thailand | 0.0 /100 | #288 | Tragic 97.2% |
| Houma | 0.0 /100 | #289 | Tragic 97.2% |
| Immigrants | St. Vincent and the Grenadines | 0.0 /100 | #290 | Tragic 97.2% |
| Immigrants | Afghanistan | 0.0 /100 | #291 | Tragic 97.2% |
| Immigrants | Eritrea | 0.0 /100 | #292 | Tragic 97.2% |
| British West Indians | 0.0 /100 | #293 | Tragic 97.2% |
| Malaysians | 0.0 /100 | #294 | Tragic 97.1% |
| Immigrants | Grenada | 0.0 /100 | #295 | Tragic 97.1% |
| Immigrants | Immigrants | 0.0 /100 | #296 | Tragic 97.1% |
| Immigrants | Cuba | 0.0 /100 | #297 | Tragic 97.0% |
| Immigrants | Dominica | 0.0 /100 | #298 | Tragic 97.0% |
| Haitians | 0.0 /100 | #299 | Tragic 97.0% |
Demographics Similar to Africans by 2nd Grade
In terms of 2nd grade, the demographic groups most similar to Africans are Immigrants from Southern Europe (97.8%, a difference of 0.010%), Immigrants from Chile (97.7%, a difference of 0.010%), Yuman (97.8%, a difference of 0.020%), Immigrants from Albania (97.8%, a difference of 0.020%), and Immigrants from Northern Africa (97.7%, a difference of 0.020%).
| Demographics | Rating | Rank | 2nd Grade |
| Immigrants | Lebanon | 20.9 /100 | #200 | Fair 97.8% |
| Tohono O'odham | 20.9 /100 | #201 | Fair 97.8% |
| Immigrants | Ukraine | 20.5 /100 | #202 | Fair 97.8% |
| Yuman | 20.0 /100 | #203 | Fair 97.8% |
| Immigrants | Albania | 18.4 /100 | #204 | Poor 97.8% |
| Immigrants | Southern Europe | 18.1 /100 | #205 | Poor 97.8% |
| Immigrants | Chile | 17.3 /100 | #206 | Poor 97.7% |
| Africans | 15.6 /100 | #207 | Poor 97.7% |
| Immigrants | Northern Africa | 12.3 /100 | #208 | Poor 97.7% |
| Immigrants | Oceania | 10.9 /100 | #209 | Poor 97.7% |
| Costa Ricans | 10.5 /100 | #210 | Poor 97.7% |
| Laotians | 9.9 /100 | #211 | Tragic 97.7% |
| Immigrants | Bahamas | 8.4 /100 | #212 | Tragic 97.7% |
| Moroccans | 8.2 /100 | #213 | Tragic 97.7% |
| Samoans | 7.1 /100 | #214 | Tragic 97.7% |