Aleut vs Immigrants from Trinidad and Tobago 2nd Grade
COMPARE
Aleut
Immigrants from Trinidad and Tobago
2nd Grade
2nd Grade Comparison
Aleuts
Immigrants from Trinidad and Tobago
98.6%
2ND GRADE
100.0/ 100
METRIC RATING
17th/ 347
METRIC RANK
97.2%
2ND GRADE
0.0/ 100
METRIC RATING
283rd/ 347
METRIC RANK
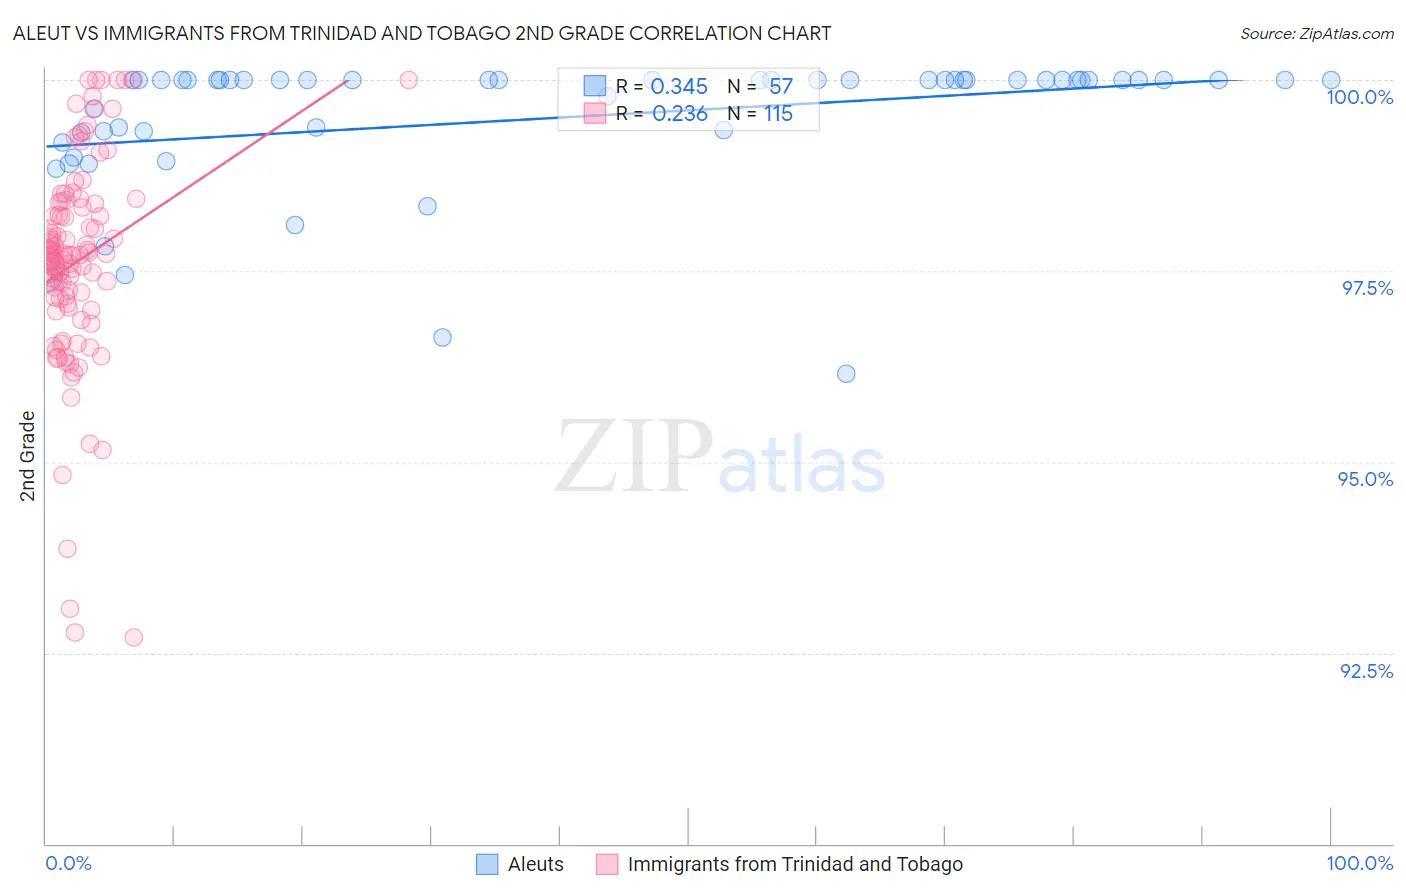
Aleut vs Immigrants from Trinidad and Tobago 2nd Grade Correlation Chart
The statistical analysis conducted on geographies consisting of 61,781,033 people shows a mild positive correlation between the proportion of Aleuts and percentage of population with at least 2nd grade education in the United States with a correlation coefficient (R) of 0.345 and weighted average of 98.6%. Similarly, the statistical analysis conducted on geographies consisting of 223,545,304 people shows a weak positive correlation between the proportion of Immigrants from Trinidad and Tobago and percentage of population with at least 2nd grade education in the United States with a correlation coefficient (R) of 0.236 and weighted average of 97.2%, a difference of 1.4%.
2nd Grade Correlation Summary
| Measurement | Aleut | Immigrants from Trinidad and Tobago |
| Minimum | 96.2% | 92.7% |
| Maximum | 100.0% | 100.0% |
| Range | 3.8% | 7.3% |
| Mean | 99.5% | 97.6% |
| Median | 100.0% | 97.7% |
| Interquartile 25% (IQ1) | 99.3% | 97.1% |
| Interquartile 75% (IQ3) | 100.0% | 98.4% |
| Interquartile Range (IQR) | 0.68% | 1.3% |
| Standard Deviation (Sample) | 0.90% | 1.4% |
| Standard Deviation (Population) | 0.89% | 1.4% |
Similar Demographics by 2nd Grade
Demographics Similar to Aleuts by 2nd Grade
In terms of 2nd grade, the demographic groups most similar to Aleuts are Irish (98.6%, a difference of 0.0%), Finnish (98.5%, a difference of 0.010%), Scottish (98.6%, a difference of 0.020%), Dutch (98.6%, a difference of 0.020%), and Sioux (98.5%, a difference of 0.020%).
| Demographics | Rating | Rank | 2nd Grade |
| Slovenes | 100.0 /100 | #10 | Exceptional 98.6% |
| Tlingit-Haida | 100.0 /100 | #11 | Exceptional 98.6% |
| Carpatho Rusyns | 100.0 /100 | #12 | Exceptional 98.6% |
| English | 100.0 /100 | #13 | Exceptional 98.6% |
| Swedes | 100.0 /100 | #14 | Exceptional 98.6% |
| Scottish | 100.0 /100 | #15 | Exceptional 98.6% |
| Dutch | 100.0 /100 | #16 | Exceptional 98.6% |
| Aleuts | 100.0 /100 | #17 | Exceptional 98.6% |
| Irish | 100.0 /100 | #18 | Exceptional 98.6% |
| Finns | 100.0 /100 | #19 | Exceptional 98.5% |
| Sioux | 100.0 /100 | #20 | Exceptional 98.5% |
| Lithuanians | 100.0 /100 | #21 | Exceptional 98.5% |
| Poles | 100.0 /100 | #22 | Exceptional 98.5% |
| Danes | 100.0 /100 | #23 | Exceptional 98.5% |
| Pennsylvania Germans | 100.0 /100 | #24 | Exceptional 98.5% |
Demographics Similar to Immigrants from Trinidad and Tobago by 2nd Grade
In terms of 2nd grade, the demographic groups most similar to Immigrants from Trinidad and Tobago are Immigrants from West Indies (97.2%, a difference of 0.010%), Immigrants from Hong Kong (97.2%, a difference of 0.020%), Immigrants from Barbados (97.2%, a difference of 0.020%), Immigrants from Portugal (97.2%, a difference of 0.020%), and Immigrants from Thailand (97.2%, a difference of 0.030%).
| Demographics | Rating | Rank | 2nd Grade |
| Immigrants | Philippines | 0.1 /100 | #276 | Tragic 97.3% |
| Immigrants | Western Africa | 0.1 /100 | #277 | Tragic 97.3% |
| Immigrants | Uzbekistan | 0.1 /100 | #278 | Tragic 97.3% |
| Immigrants | Ghana | 0.1 /100 | #279 | Tragic 97.3% |
| Afghans | 0.1 /100 | #280 | Tragic 97.3% |
| Trinidadians and Tobagonians | 0.1 /100 | #281 | Tragic 97.3% |
| Barbadians | 0.1 /100 | #282 | Tragic 97.3% |
| Immigrants | Trinidad and Tobago | 0.0 /100 | #283 | Tragic 97.2% |
| Immigrants | West Indies | 0.0 /100 | #284 | Tragic 97.2% |
| Immigrants | Hong Kong | 0.0 /100 | #285 | Tragic 97.2% |
| Immigrants | Barbados | 0.0 /100 | #286 | Tragic 97.2% |
| Immigrants | Portugal | 0.0 /100 | #287 | Tragic 97.2% |
| Immigrants | Thailand | 0.0 /100 | #288 | Tragic 97.2% |
| Houma | 0.0 /100 | #289 | Tragic 97.2% |
| Immigrants | St. Vincent and the Grenadines | 0.0 /100 | #290 | Tragic 97.2% |