Estonian vs African 2nd Grade
COMPARE
Estonian
African
2nd Grade
2nd Grade Comparison
Estonians
Africans
98.4%
2ND GRADE
99.8/ 100
METRIC RATING
51st/ 347
METRIC RANK
97.7%
2ND GRADE
15.6/ 100
METRIC RATING
207th/ 347
METRIC RANK
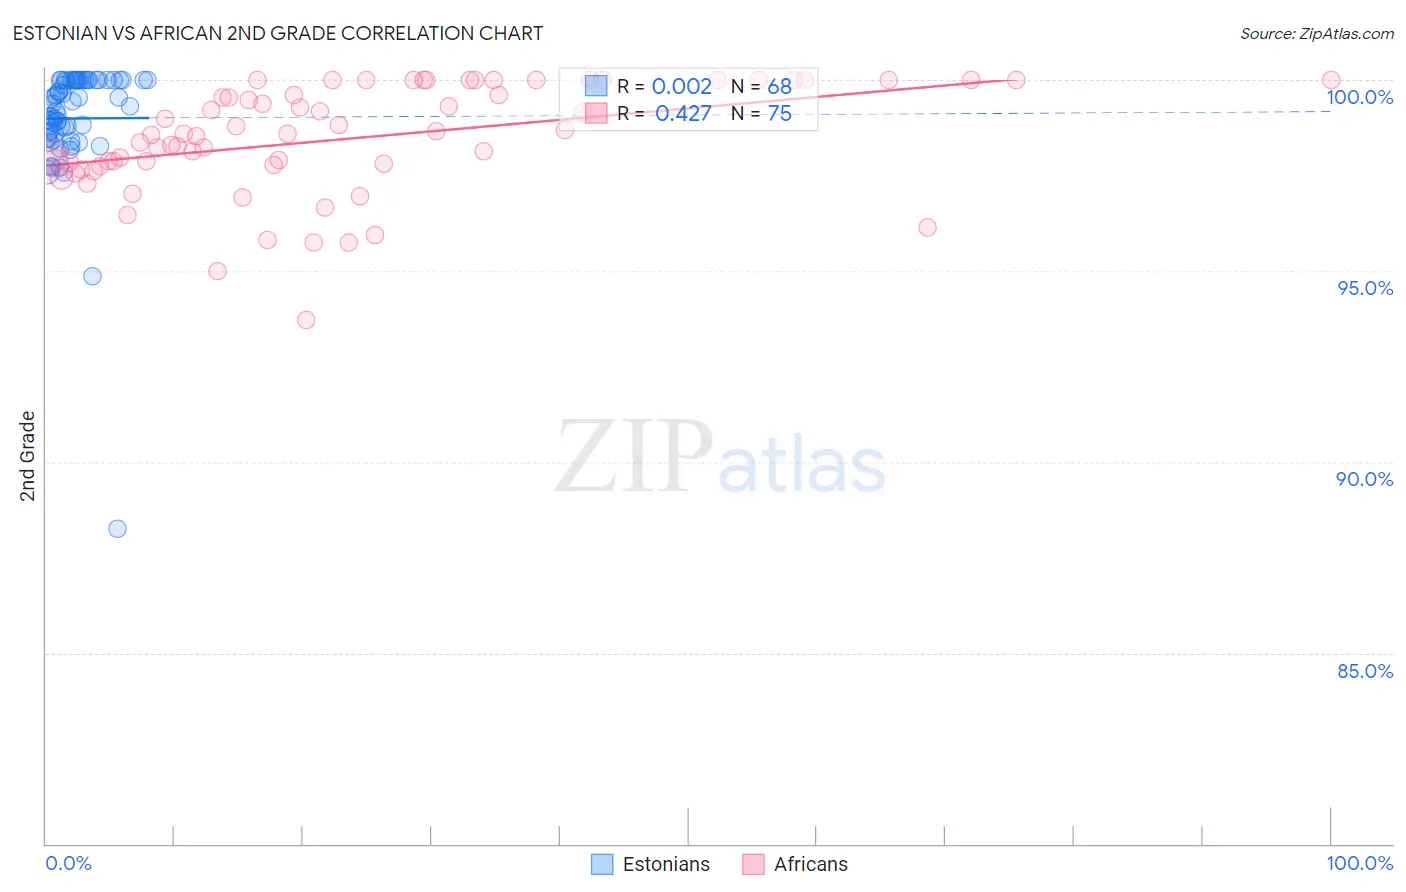
Estonian vs African 2nd Grade Correlation Chart
The statistical analysis conducted on geographies consisting of 123,528,404 people shows no correlation between the proportion of Estonians and percentage of population with at least 2nd grade education in the United States with a correlation coefficient (R) of 0.002 and weighted average of 98.4%. Similarly, the statistical analysis conducted on geographies consisting of 470,094,148 people shows a moderate positive correlation between the proportion of Africans and percentage of population with at least 2nd grade education in the United States with a correlation coefficient (R) of 0.427 and weighted average of 97.7%, a difference of 0.64%.
2nd Grade Correlation Summary
| Measurement | Estonian | African |
| Minimum | 88.3% | 93.7% |
| Maximum | 100.0% | 100.0% |
| Range | 11.7% | 6.3% |
| Mean | 99.0% | 98.5% |
| Median | 99.3% | 98.6% |
| Interquartile 25% (IQ1) | 98.5% | 97.8% |
| Interquartile 75% (IQ3) | 100.0% | 100.0% |
| Interquartile Range (IQR) | 1.5% | 2.2% |
| Standard Deviation (Sample) | 1.6% | 1.4% |
| Standard Deviation (Population) | 1.6% | 1.4% |
Similar Demographics by 2nd Grade
Demographics Similar to Estonians by 2nd Grade
In terms of 2nd grade, the demographic groups most similar to Estonians are Celtic (98.4%, a difference of 0.0%), White/Caucasian (98.4%, a difference of 0.0%), Australian (98.4%, a difference of 0.0%), Czechoslovakian (98.4%, a difference of 0.010%), and Pueblo (98.3%, a difference of 0.010%).
| Demographics | Rating | Rank | 2nd Grade |
| Northern Europeans | 99.9 /100 | #44 | Exceptional 98.4% |
| Hungarians | 99.9 /100 | #45 | Exceptional 98.4% |
| Lumbee | 99.9 /100 | #46 | Exceptional 98.4% |
| Ottawa | 99.9 /100 | #47 | Exceptional 98.4% |
| Czechoslovakians | 99.9 /100 | #48 | Exceptional 98.4% |
| Celtics | 99.8 /100 | #49 | Exceptional 98.4% |
| Whites/Caucasians | 99.8 /100 | #50 | Exceptional 98.4% |
| Estonians | 99.8 /100 | #51 | Exceptional 98.4% |
| Australians | 99.8 /100 | #52 | Exceptional 98.4% |
| Pueblo | 99.8 /100 | #53 | Exceptional 98.3% |
| Kiowa | 99.8 /100 | #54 | Exceptional 98.3% |
| Immigrants | Scotland | 99.8 /100 | #55 | Exceptional 98.3% |
| Americans | 99.8 /100 | #56 | Exceptional 98.3% |
| Austrians | 99.8 /100 | #57 | Exceptional 98.3% |
| Bulgarians | 99.8 /100 | #58 | Exceptional 98.3% |
Demographics Similar to Africans by 2nd Grade
In terms of 2nd grade, the demographic groups most similar to Africans are Immigrants from Southern Europe (97.8%, a difference of 0.010%), Immigrants from Chile (97.7%, a difference of 0.010%), Yuman (97.8%, a difference of 0.020%), Immigrants from Albania (97.8%, a difference of 0.020%), and Immigrants from Northern Africa (97.7%, a difference of 0.020%).
| Demographics | Rating | Rank | 2nd Grade |
| Immigrants | Lebanon | 20.9 /100 | #200 | Fair 97.8% |
| Tohono O'odham | 20.9 /100 | #201 | Fair 97.8% |
| Immigrants | Ukraine | 20.5 /100 | #202 | Fair 97.8% |
| Yuman | 20.0 /100 | #203 | Fair 97.8% |
| Immigrants | Albania | 18.4 /100 | #204 | Poor 97.8% |
| Immigrants | Southern Europe | 18.1 /100 | #205 | Poor 97.8% |
| Immigrants | Chile | 17.3 /100 | #206 | Poor 97.7% |
| Africans | 15.6 /100 | #207 | Poor 97.7% |
| Immigrants | Northern Africa | 12.3 /100 | #208 | Poor 97.7% |
| Immigrants | Oceania | 10.9 /100 | #209 | Poor 97.7% |
| Costa Ricans | 10.5 /100 | #210 | Poor 97.7% |
| Laotians | 9.9 /100 | #211 | Tragic 97.7% |
| Immigrants | Bahamas | 8.4 /100 | #212 | Tragic 97.7% |
| Moroccans | 8.2 /100 | #213 | Tragic 97.7% |
| Samoans | 7.1 /100 | #214 | Tragic 97.7% |