Albanian vs Spanish American 8th Grade
COMPARE
Albanian
Spanish American
8th Grade
8th Grade Comparison
Albanians
Spanish Americans
96.0%
8TH GRADE
83.1/ 100
METRIC RATING
148th/ 347
METRIC RANK
95.4%
8TH GRADE
8.0/ 100
METRIC RATING
219th/ 347
METRIC RANK
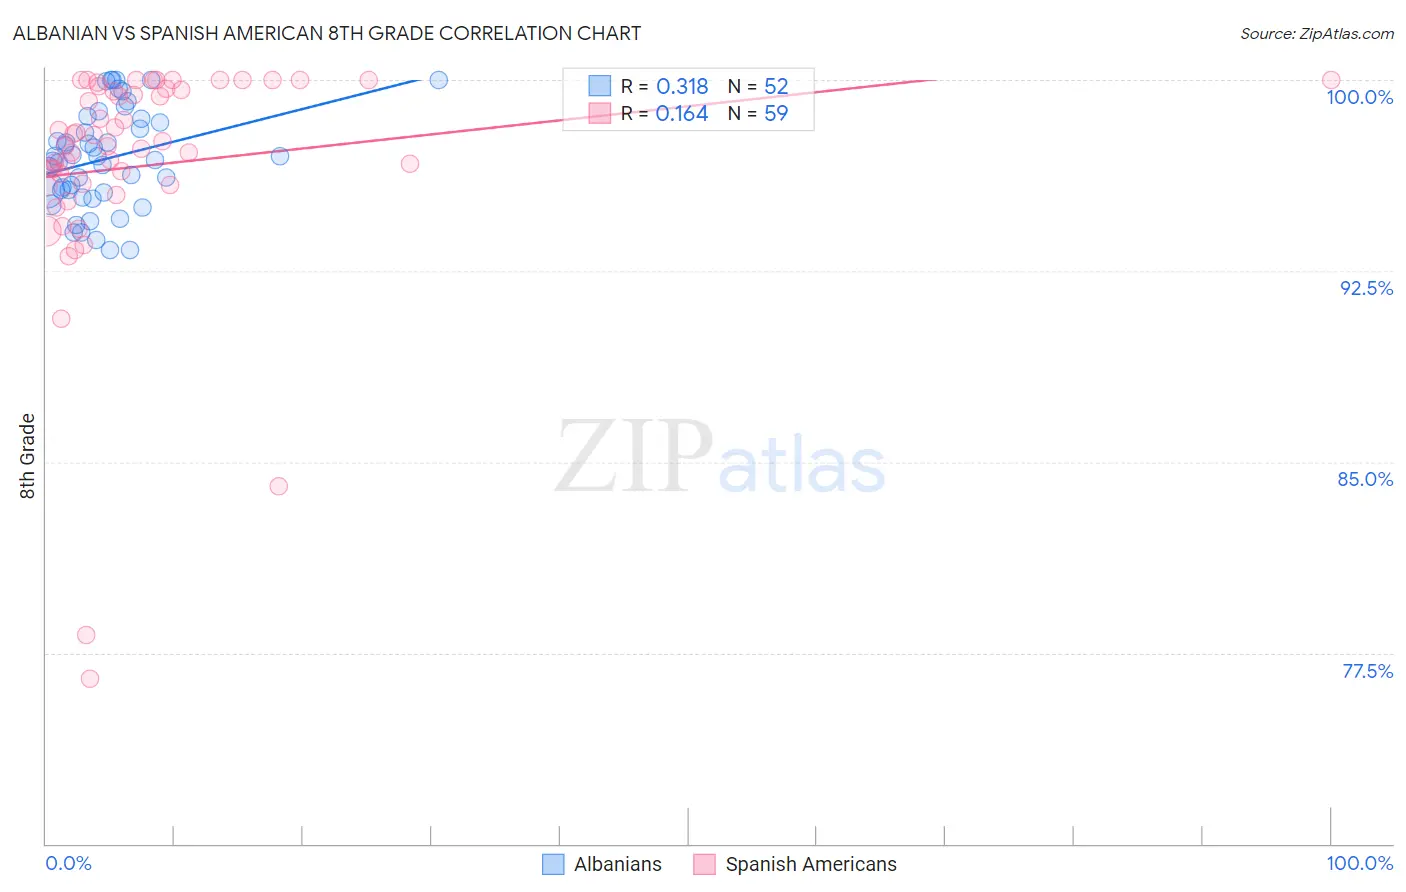
Albanian vs Spanish American 8th Grade Correlation Chart
The statistical analysis conducted on geographies consisting of 193,265,850 people shows a mild positive correlation between the proportion of Albanians and percentage of population with at least 8th grade education in the United States with a correlation coefficient (R) of 0.318 and weighted average of 96.0%. Similarly, the statistical analysis conducted on geographies consisting of 103,168,542 people shows a poor positive correlation between the proportion of Spanish Americans and percentage of population with at least 8th grade education in the United States with a correlation coefficient (R) of 0.164 and weighted average of 95.4%, a difference of 0.66%.
8th Grade Correlation Summary
| Measurement | Albanian | Spanish American |
| Minimum | 93.3% | 76.5% |
| Maximum | 100.0% | 100.0% |
| Range | 6.7% | 23.5% |
| Mean | 96.9% | 96.6% |
| Median | 96.9% | 97.4% |
| Interquartile 25% (IQ1) | 95.6% | 95.9% |
| Interquartile 75% (IQ3) | 98.4% | 99.7% |
| Interquartile Range (IQR) | 2.8% | 3.8% |
| Standard Deviation (Sample) | 1.9% | 4.6% |
| Standard Deviation (Population) | 1.9% | 4.6% |
Similar Demographics by 8th Grade
Demographics Similar to Albanians by 8th Grade
In terms of 8th grade, the demographic groups most similar to Albanians are Lumbee (96.0%, a difference of 0.010%), Israeli (96.0%, a difference of 0.010%), Colville (96.0%, a difference of 0.010%), Spanish (96.0%, a difference of 0.020%), and Immigrants from Belarus (96.0%, a difference of 0.020%).
| Demographics | Rating | Rank | 8th Grade |
| Immigrants | Greece | 85.9 /100 | #141 | Excellent 96.0% |
| Immigrants | Eastern Europe | 85.4 /100 | #142 | Excellent 96.0% |
| Spanish | 85.1 /100 | #143 | Excellent 96.0% |
| Immigrants | Belarus | 84.8 /100 | #144 | Excellent 96.0% |
| Lumbee | 84.1 /100 | #145 | Excellent 96.0% |
| Israelis | 84.1 /100 | #146 | Excellent 96.0% |
| Colville | 84.0 /100 | #147 | Excellent 96.0% |
| Albanians | 83.1 /100 | #148 | Excellent 96.0% |
| Immigrants | Israel | 81.3 /100 | #149 | Excellent 96.0% |
| Immigrants | Russia | 80.9 /100 | #150 | Excellent 96.0% |
| Blackfeet | 80.8 /100 | #151 | Excellent 96.0% |
| French American Indians | 80.6 /100 | #152 | Excellent 96.0% |
| Immigrants | Jordan | 79.5 /100 | #153 | Good 95.9% |
| Hopi | 79.4 /100 | #154 | Good 95.9% |
| Kenyans | 74.5 /100 | #155 | Good 95.9% |
Demographics Similar to Spanish Americans by 8th Grade
In terms of 8th grade, the demographic groups most similar to Spanish Americans are Dutch West Indian (95.4%, a difference of 0.0%), Samoan (95.4%, a difference of 0.010%), Immigrants from Eastern Asia (95.4%, a difference of 0.010%), Immigrants from Southern Europe (95.3%, a difference of 0.010%), and Immigrants from Syria (95.3%, a difference of 0.010%).
| Demographics | Rating | Rank | 8th Grade |
| Immigrants | Pakistan | 9.7 /100 | #212 | Tragic 95.4% |
| Laotians | 9.0 /100 | #213 | Tragic 95.4% |
| Immigrants | Chile | 9.0 /100 | #214 | Tragic 95.4% |
| Immigrants | Liberia | 8.9 /100 | #215 | Tragic 95.4% |
| Samoans | 8.4 /100 | #216 | Tragic 95.4% |
| Immigrants | Eastern Asia | 8.3 /100 | #217 | Tragic 95.4% |
| Dutch West Indians | 8.1 /100 | #218 | Tragic 95.4% |
| Spanish Americans | 8.0 /100 | #219 | Tragic 95.4% |
| Immigrants | Southern Europe | 7.7 /100 | #220 | Tragic 95.3% |
| Immigrants | Syria | 7.4 /100 | #221 | Tragic 95.3% |
| Immigrants | Malaysia | 7.3 /100 | #222 | Tragic 95.3% |
| Immigrants | Oceania | 7.1 /100 | #223 | Tragic 95.3% |
| Immigrants | Western Asia | 6.0 /100 | #224 | Tragic 95.3% |
| Sub-Saharan Africans | 6.0 /100 | #225 | Tragic 95.3% |
| Navajo | 5.7 /100 | #226 | Tragic 95.3% |