Yaqui vs Spanish No Schooling Completed
COMPARE
Yaqui
Spanish
No Schooling Completed
No Schooling Completed Comparison
Yaqui
Spanish
2.4%
NO SCHOOLING COMPLETED
0.8/ 100
METRIC RATING
256th/ 347
METRIC RANK
1.9%
NO SCHOOLING COMPLETED
95.5/ 100
METRIC RATING
118th/ 347
METRIC RANK
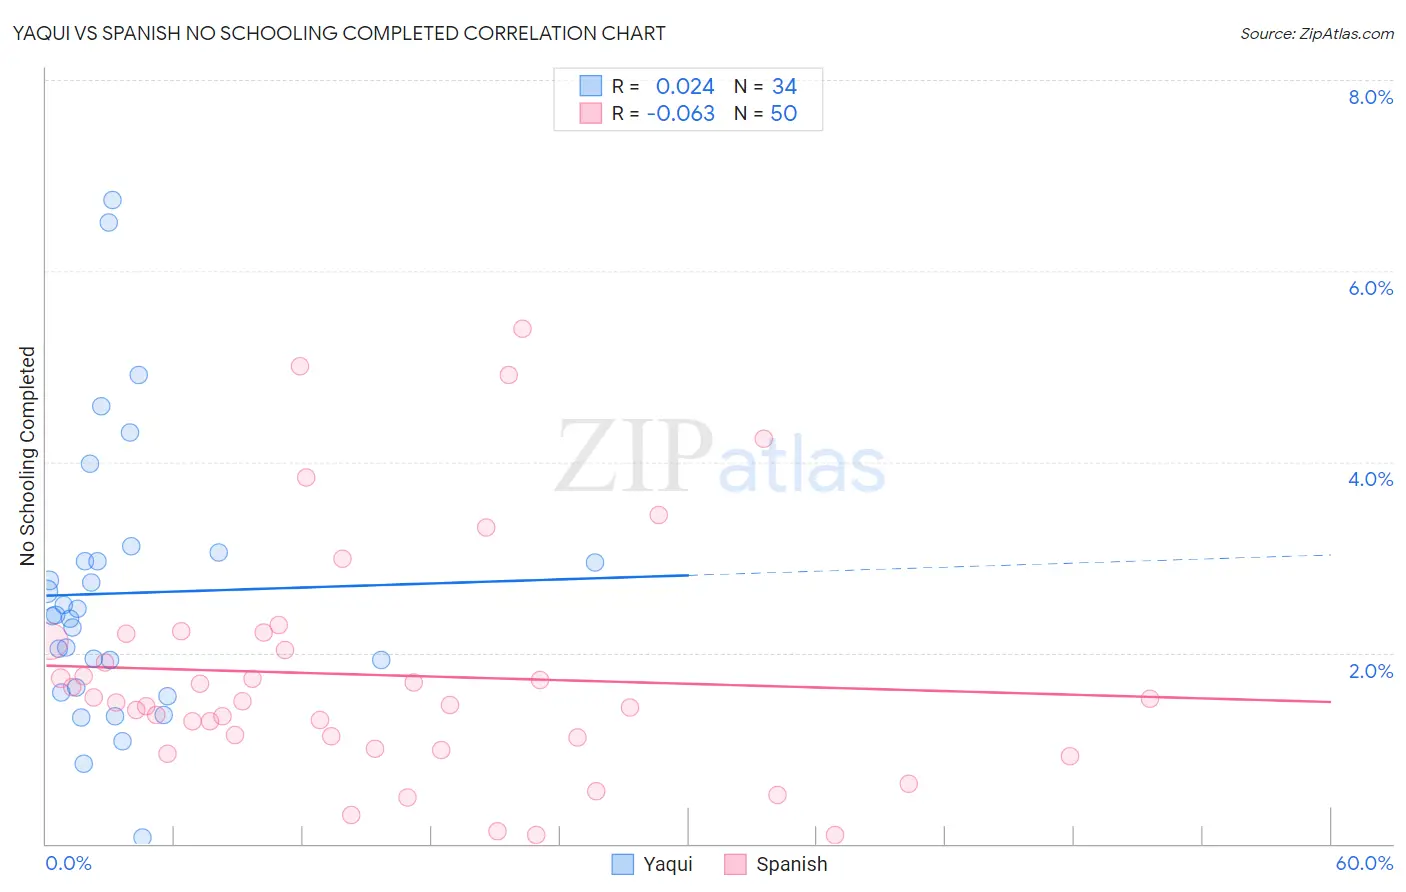
Yaqui vs Spanish No Schooling Completed Correlation Chart
The statistical analysis conducted on geographies consisting of 107,378,614 people shows no correlation between the proportion of Yaqui and percentage of population with no schooling in the United States with a correlation coefficient (R) of 0.024 and weighted average of 2.4%. Similarly, the statistical analysis conducted on geographies consisting of 416,846,352 people shows a slight negative correlation between the proportion of Spanish and percentage of population with no schooling in the United States with a correlation coefficient (R) of -0.063 and weighted average of 1.9%, a difference of 29.6%.
No Schooling Completed Correlation Summary
| Measurement | Yaqui | Spanish |
| Minimum | 0.072% | 0.088% |
| Maximum | 6.7% | 5.4% |
| Range | 6.7% | 5.3% |
| Mean | 2.6% | 1.8% |
| Median | 2.4% | 1.5% |
| Interquartile 25% (IQ1) | 1.6% | 1.1% |
| Interquartile 75% (IQ3) | 3.0% | 2.1% |
| Interquartile Range (IQR) | 1.3% | 1.0% |
| Standard Deviation (Sample) | 1.4% | 1.2% |
| Standard Deviation (Population) | 1.4% | 1.2% |
Similar Demographics by No Schooling Completed
Demographics Similar to Yaqui by No Schooling Completed
In terms of no schooling completed, the demographic groups most similar to Yaqui are Ethiopian (2.4%, a difference of 0.17%), Immigrants from Eastern Africa (2.4%, a difference of 0.37%), Immigrants from Asia (2.4%, a difference of 0.50%), Immigrants from Colombia (2.4%, a difference of 0.62%), and Immigrants from South America (2.5%, a difference of 0.87%).
| Demographics | Rating | Rank | No Schooling Completed |
| Jamaicans | 1.2 /100 | #249 | Tragic 2.4% |
| Immigrants | Middle Africa | 1.1 /100 | #250 | Tragic 2.4% |
| Immigrants | Africa | 1.1 /100 | #251 | Tragic 2.4% |
| Immigrants | Colombia | 1.0 /100 | #252 | Tragic 2.4% |
| Immigrants | Asia | 0.9 /100 | #253 | Tragic 2.4% |
| Immigrants | Eastern Africa | 0.9 /100 | #254 | Tragic 2.4% |
| Ethiopians | 0.8 /100 | #255 | Tragic 2.4% |
| Yaqui | 0.8 /100 | #256 | Tragic 2.4% |
| Immigrants | South America | 0.6 /100 | #257 | Tragic 2.5% |
| Assyrians/Chaldeans/Syriacs | 0.6 /100 | #258 | Tragic 2.5% |
| Immigrants | Jamaica | 0.6 /100 | #259 | Tragic 2.5% |
| Immigrants | Ethiopia | 0.6 /100 | #260 | Tragic 2.5% |
| Armenians | 0.5 /100 | #261 | Tragic 2.5% |
| Immigrants | Sierra Leone | 0.5 /100 | #262 | Tragic 2.5% |
| Immigrants | Liberia | 0.4 /100 | #263 | Tragic 2.5% |
Demographics Similar to Spanish by No Schooling Completed
In terms of no schooling completed, the demographic groups most similar to Spanish are Immigrants from Serbia (1.9%, a difference of 0.24%), Iroquois (1.9%, a difference of 0.35%), Lebanese (1.9%, a difference of 0.44%), Syrian (1.9%, a difference of 0.46%), and Immigrants from Norway (1.9%, a difference of 0.59%).
| Demographics | Rating | Rank | No Schooling Completed |
| Immigrants | Japan | 96.6 /100 | #111 | Exceptional 1.9% |
| Pueblo | 96.4 /100 | #112 | Exceptional 1.9% |
| Immigrants | Zimbabwe | 96.2 /100 | #113 | Exceptional 1.9% |
| Immigrants | Norway | 96.1 /100 | #114 | Exceptional 1.9% |
| Syrians | 96.0 /100 | #115 | Exceptional 1.9% |
| Lebanese | 96.0 /100 | #116 | Exceptional 1.9% |
| Immigrants | Serbia | 95.8 /100 | #117 | Exceptional 1.9% |
| Spanish | 95.5 /100 | #118 | Exceptional 1.9% |
| Iroquois | 95.1 /100 | #119 | Exceptional 1.9% |
| Immigrants | Bulgaria | 94.6 /100 | #120 | Exceptional 1.9% |
| Immigrants | Croatia | 94.5 /100 | #121 | Exceptional 1.9% |
| Cree | 94.5 /100 | #122 | Exceptional 1.9% |
| Immigrants | Kuwait | 93.9 /100 | #123 | Exceptional 1.9% |
| Cambodians | 93.8 /100 | #124 | Exceptional 1.9% |
| Immigrants | Europe | 93.7 /100 | #125 | Exceptional 1.9% |