Albanian vs Moroccan Householder Income Over 65 years
COMPARE
Albanian
Moroccan
Householder Income Over 65 years
Householder Income Over 65 years Comparison
Albanians
Moroccans
$60,249
HOUSEHOLDER INCOME OVER 65 YEARS
32.0/ 100
METRIC RATING
185th/ 347
METRIC RANK
$59,683
HOUSEHOLDER INCOME OVER 65 YEARS
20.7/ 100
METRIC RATING
198th/ 347
METRIC RANK
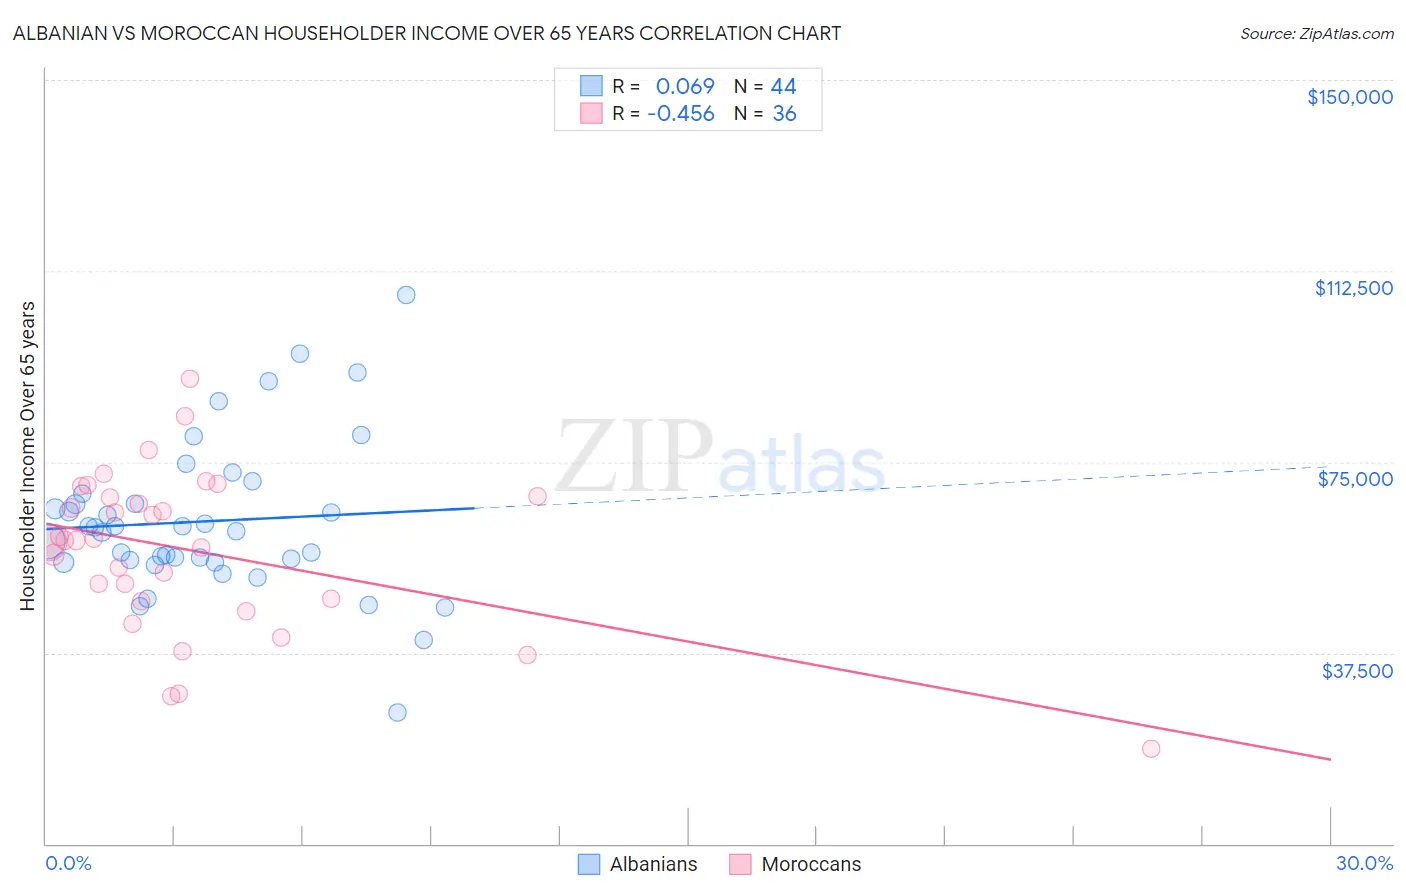
Albanian vs Moroccan Householder Income Over 65 years Correlation Chart
The statistical analysis conducted on geographies consisting of 192,894,684 people shows a slight positive correlation between the proportion of Albanians and household income with householder over the age of 65 in the United States with a correlation coefficient (R) of 0.069 and weighted average of $60,249. Similarly, the statistical analysis conducted on geographies consisting of 201,528,481 people shows a moderate negative correlation between the proportion of Moroccans and household income with householder over the age of 65 in the United States with a correlation coefficient (R) of -0.456 and weighted average of $59,683, a difference of 0.95%.
Householder Income Over 65 years Correlation Summary
| Measurement | Albanian | Moroccan |
| Minimum | $25,833 | $18,625 |
| Maximum | $107,661 | $91,360 |
| Range | $81,828 | $72,735 |
| Mean | $63,338 | $57,561 |
| Median | $61,807 | $59,547 |
| Interquartile 25% (IQ1) | $55,515 | $47,767 |
| Interquartile 75% (IQ3) | $67,768 | $68,126 |
| Interquartile Range (IQR) | $12,253 | $20,359 |
| Standard Deviation (Sample) | $15,246 | $15,674 |
| Standard Deviation (Population) | $15,071 | $15,455 |
Demographics Similar to Albanians and Moroccans by Householder Income Over 65 years
In terms of householder income over 65 years, the demographic groups most similar to Albanians are Slovene ($60,241, a difference of 0.010%), Immigrants from Thailand ($60,217, a difference of 0.050%), Immigrants from Eritrea ($60,096, a difference of 0.26%), Ghanaian ($60,043, a difference of 0.34%), and Iraqi ($60,466, a difference of 0.36%). Similarly, the demographic groups most similar to Moroccans are Immigrants from Kenya ($59,710, a difference of 0.040%), Immigrants ($59,656, a difference of 0.050%), French ($59,656, a difference of 0.050%), German ($59,730, a difference of 0.080%), and Immigrants from Iraq ($59,824, a difference of 0.24%).
| Demographics | Rating | Rank | Householder Income Over 65 years |
| Celtics | 40.7 /100 | #181 | Average $60,608 |
| Czechoslovakians | 40.0 /100 | #182 | Average $60,581 |
| Kenyans | 38.4 /100 | #183 | Fair $60,514 |
| Iraqis | 37.2 /100 | #184 | Fair $60,466 |
| Albanians | 32.0 /100 | #185 | Fair $60,249 |
| Slovenes | 31.8 /100 | #186 | Fair $60,241 |
| Immigrants | Thailand | 31.3 /100 | #187 | Fair $60,217 |
| Immigrants | Eritrea | 28.6 /100 | #188 | Fair $60,096 |
| Ghanaians | 27.5 /100 | #189 | Fair $60,043 |
| Puget Sound Salish | 25.3 /100 | #190 | Fair $59,934 |
| Belgians | 24.9 /100 | #191 | Fair $59,915 |
| South Americans | 23.8 /100 | #192 | Fair $59,854 |
| Immigrants | Costa Rica | 23.6 /100 | #193 | Fair $59,848 |
| Immigrants | Africa | 23.4 /100 | #194 | Fair $59,837 |
| Immigrants | Iraq | 23.2 /100 | #195 | Fair $59,824 |
| Germans | 21.5 /100 | #196 | Fair $59,730 |
| Immigrants | Kenya | 21.1 /100 | #197 | Fair $59,710 |
| Moroccans | 20.7 /100 | #198 | Fair $59,683 |
| Immigrants | Immigrants | 20.2 /100 | #199 | Fair $59,656 |
| French | 20.2 /100 | #200 | Fair $59,656 |
| Dutch | 18.3 /100 | #201 | Poor $59,539 |