Northern European vs Immigrants from Saudi Arabia No Schooling Completed
COMPARE
Northern European
Immigrants from Saudi Arabia
No Schooling Completed
No Schooling Completed Comparison
Northern Europeans
Immigrants from Saudi Arabia
1.6%
NO SCHOOLING COMPLETED
99.9/ 100
METRIC RATING
38th/ 347
METRIC RANK
1.9%
NO SCHOOLING COMPLETED
96.8/ 100
METRIC RATING
109th/ 347
METRIC RANK
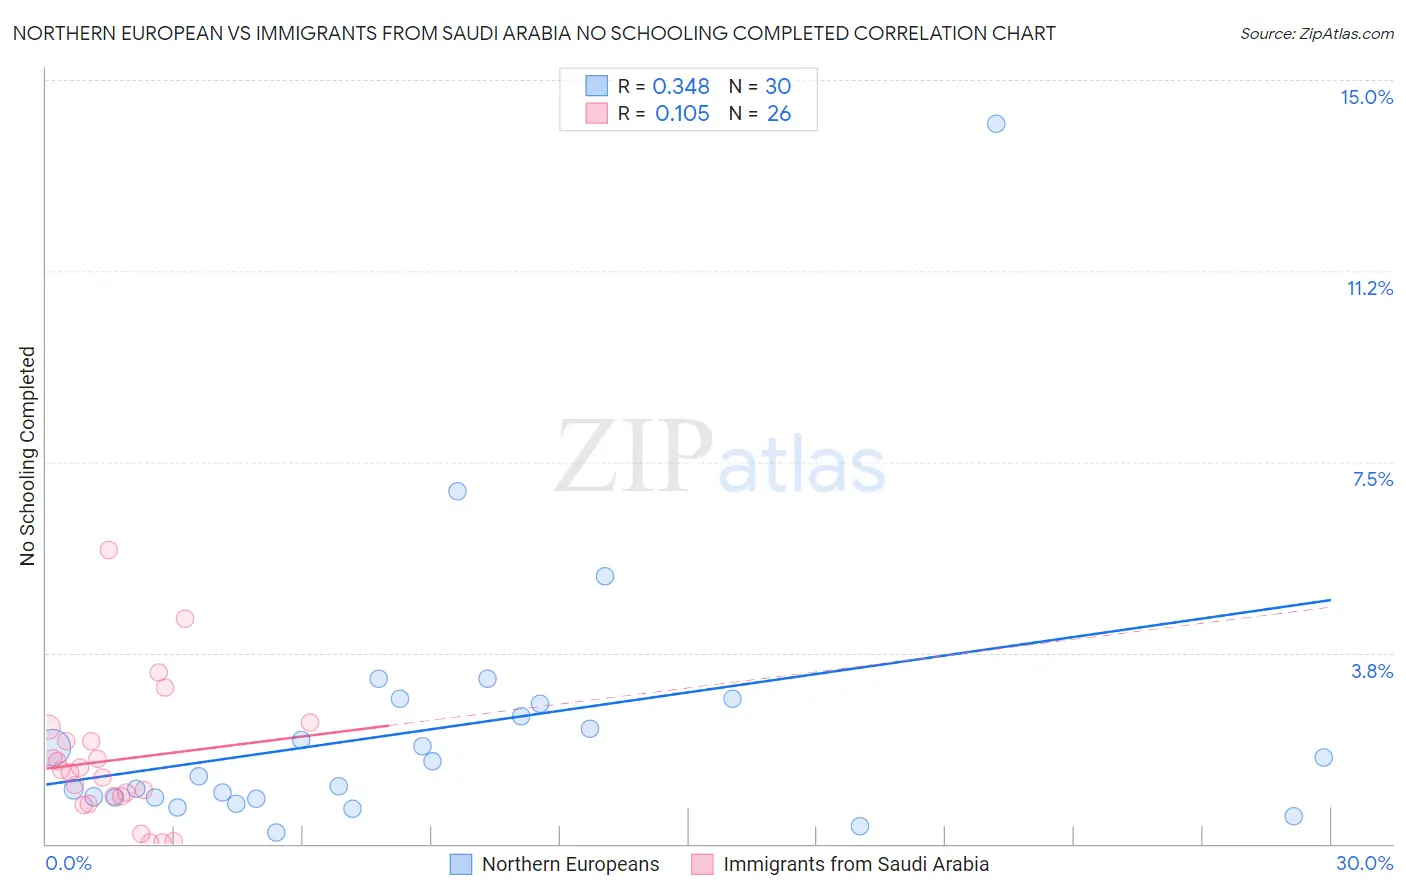
Northern European vs Immigrants from Saudi Arabia No Schooling Completed Correlation Chart
The statistical analysis conducted on geographies consisting of 399,870,964 people shows a mild positive correlation between the proportion of Northern Europeans and percentage of population with no schooling in the United States with a correlation coefficient (R) of 0.348 and weighted average of 1.6%. Similarly, the statistical analysis conducted on geographies consisting of 163,882,762 people shows a poor positive correlation between the proportion of Immigrants from Saudi Arabia and percentage of population with no schooling in the United States with a correlation coefficient (R) of 0.105 and weighted average of 1.9%, a difference of 17.3%.
No Schooling Completed Correlation Summary
| Measurement | Northern European | Immigrants from Saudi Arabia |
| Minimum | 0.21% | 0.031% |
| Maximum | 14.1% | 5.8% |
| Range | 13.9% | 5.7% |
| Mean | 2.3% | 1.6% |
| Median | 1.5% | 1.4% |
| Interquartile 25% (IQ1) | 0.90% | 0.93% |
| Interquartile 75% (IQ3) | 2.8% | 2.0% |
| Interquartile Range (IQR) | 1.8% | 1.1% |
| Standard Deviation (Sample) | 2.7% | 1.3% |
| Standard Deviation (Population) | 2.6% | 1.3% |
Similar Demographics by No Schooling Completed
Demographics Similar to Northern Europeans by No Schooling Completed
In terms of no schooling completed, the demographic groups most similar to Northern Europeans are Belgian (1.6%, a difference of 0.13%), Native Hawaiian (1.6%, a difference of 0.27%), Aleut (1.6%, a difference of 0.40%), Luxembourger (1.6%, a difference of 0.61%), and Hungarian (1.6%, a difference of 0.89%).
| Demographics | Rating | Rank | No Schooling Completed |
| Inupiat | 100.0 /100 | #31 | Exceptional 1.5% |
| Swiss | 100.0 /100 | #32 | Exceptional 1.5% |
| Italians | 100.0 /100 | #33 | Exceptional 1.5% |
| Latvians | 100.0 /100 | #34 | Exceptional 1.5% |
| Eastern Europeans | 100.0 /100 | #35 | Exceptional 1.6% |
| Aleuts | 99.9 /100 | #36 | Exceptional 1.6% |
| Belgians | 99.9 /100 | #37 | Exceptional 1.6% |
| Northern Europeans | 99.9 /100 | #38 | Exceptional 1.6% |
| Native Hawaiians | 99.9 /100 | #39 | Exceptional 1.6% |
| Luxembourgers | 99.9 /100 | #40 | Exceptional 1.6% |
| Hungarians | 99.9 /100 | #41 | Exceptional 1.6% |
| Bulgarians | 99.9 /100 | #42 | Exceptional 1.6% |
| Australians | 99.9 /100 | #43 | Exceptional 1.6% |
| Estonians | 99.9 /100 | #44 | Exceptional 1.6% |
| Czechoslovakians | 99.9 /100 | #45 | Exceptional 1.6% |
Demographics Similar to Immigrants from Saudi Arabia by No Schooling Completed
In terms of no schooling completed, the demographic groups most similar to Immigrants from Saudi Arabia are Immigrants from Latvia (1.9%, a difference of 0.13%), Immigrants from Japan (1.9%, a difference of 0.28%), Okinawan (1.8%, a difference of 0.35%), Pueblo (1.9%, a difference of 0.47%), and Yugoslavian (1.8%, a difference of 0.57%).
| Demographics | Rating | Rank | No Schooling Completed |
| Immigrants | Switzerland | 97.9 /100 | #102 | Exceptional 1.8% |
| Basques | 97.9 /100 | #103 | Exceptional 1.8% |
| Thais | 97.5 /100 | #104 | Exceptional 1.8% |
| German Russians | 97.5 /100 | #105 | Exceptional 1.8% |
| Immigrants | France | 97.3 /100 | #106 | Exceptional 1.8% |
| Yugoslavians | 97.2 /100 | #107 | Exceptional 1.8% |
| Okinawans | 97.1 /100 | #108 | Exceptional 1.8% |
| Immigrants | Saudi Arabia | 96.8 /100 | #109 | Exceptional 1.9% |
| Immigrants | Latvia | 96.7 /100 | #110 | Exceptional 1.9% |
| Immigrants | Japan | 96.6 /100 | #111 | Exceptional 1.9% |
| Pueblo | 96.4 /100 | #112 | Exceptional 1.9% |
| Immigrants | Zimbabwe | 96.2 /100 | #113 | Exceptional 1.9% |
| Immigrants | Norway | 96.1 /100 | #114 | Exceptional 1.9% |
| Syrians | 96.0 /100 | #115 | Exceptional 1.9% |
| Lebanese | 96.0 /100 | #116 | Exceptional 1.9% |