Belizean vs Immigrants from Saudi Arabia No Schooling Completed
COMPARE
Belizean
Immigrants from Saudi Arabia
No Schooling Completed
No Schooling Completed Comparison
Belizeans
Immigrants from Saudi Arabia
3.0%
NO SCHOOLING COMPLETED
0.0/ 100
METRIC RATING
306th/ 347
METRIC RANK
1.9%
NO SCHOOLING COMPLETED
96.8/ 100
METRIC RATING
109th/ 347
METRIC RANK
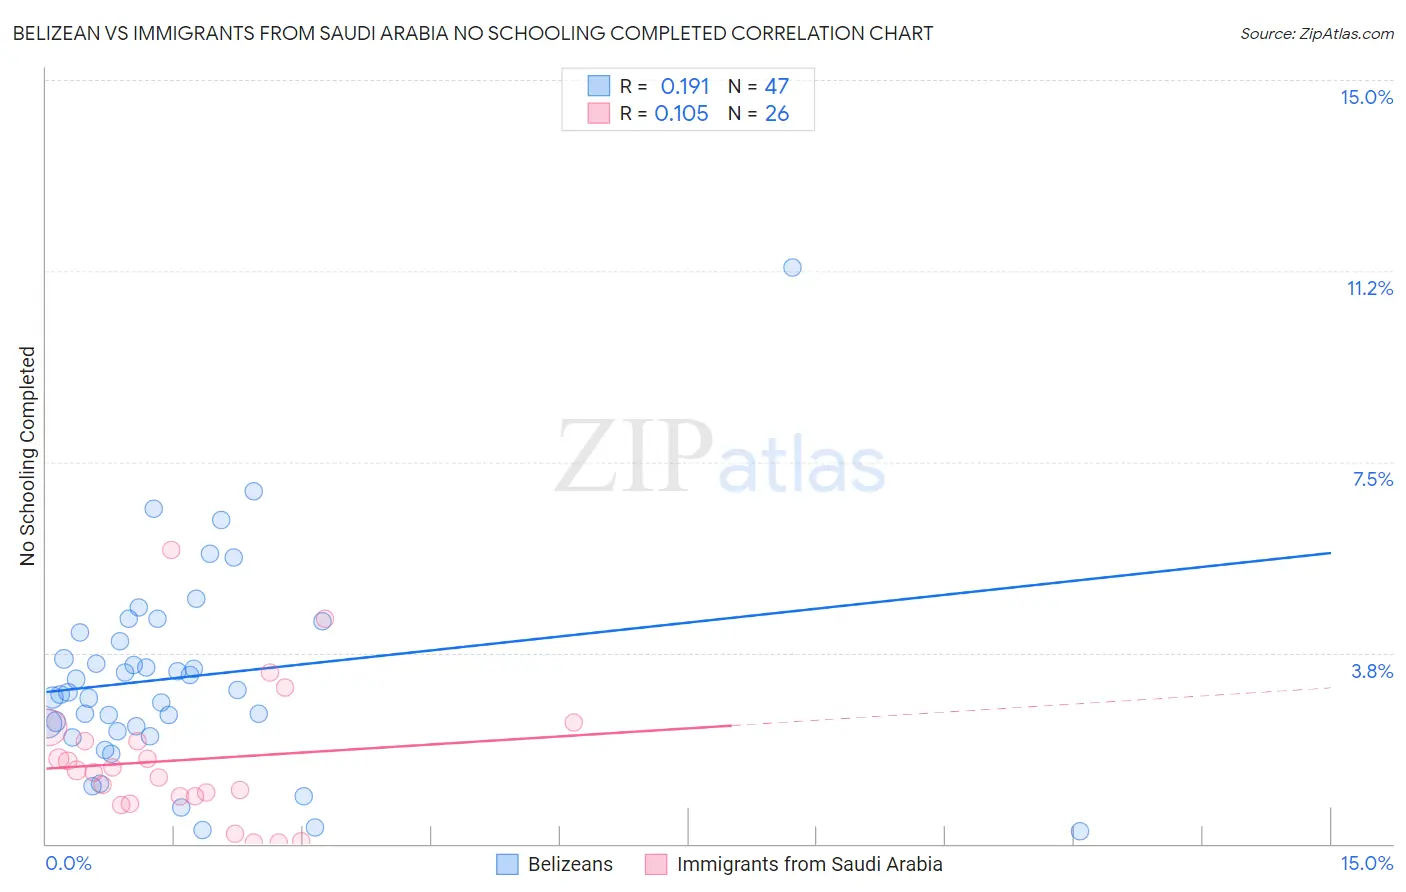
Belizean vs Immigrants from Saudi Arabia No Schooling Completed Correlation Chart
The statistical analysis conducted on geographies consisting of 143,887,803 people shows a poor positive correlation between the proportion of Belizeans and percentage of population with no schooling in the United States with a correlation coefficient (R) of 0.191 and weighted average of 3.0%. Similarly, the statistical analysis conducted on geographies consisting of 163,882,762 people shows a poor positive correlation between the proportion of Immigrants from Saudi Arabia and percentage of population with no schooling in the United States with a correlation coefficient (R) of 0.105 and weighted average of 1.9%, a difference of 62.2%.
No Schooling Completed Correlation Summary
| Measurement | Belizean | Immigrants from Saudi Arabia |
| Minimum | 0.25% | 0.031% |
| Maximum | 11.3% | 5.8% |
| Range | 11.1% | 5.7% |
| Mean | 3.3% | 1.6% |
| Median | 3.0% | 1.4% |
| Interquartile 25% (IQ1) | 2.2% | 0.93% |
| Interquartile 75% (IQ3) | 4.2% | 2.0% |
| Interquartile Range (IQR) | 1.9% | 1.1% |
| Standard Deviation (Sample) | 2.0% | 1.3% |
| Standard Deviation (Population) | 2.0% | 1.3% |
Similar Demographics by No Schooling Completed
Demographics Similar to Belizeans by No Schooling Completed
In terms of no schooling completed, the demographic groups most similar to Belizeans are Immigrants from Haiti (3.0%, a difference of 0.080%), Immigrants from Somalia (3.0%, a difference of 0.24%), Hispanic or Latino (3.0%, a difference of 1.1%), Guyanese (3.0%, a difference of 1.1%), and Immigrants from the Azores (3.0%, a difference of 1.2%).
| Demographics | Rating | Rank | No Schooling Completed |
| Central American Indians | 0.0 /100 | #299 | Tragic 2.8% |
| Haitians | 0.0 /100 | #300 | Tragic 2.9% |
| Immigrants | South Eastern Asia | 0.0 /100 | #301 | Tragic 2.9% |
| Immigrants | Caribbean | 0.0 /100 | #302 | Tragic 2.9% |
| Somalis | 0.0 /100 | #303 | Tragic 2.9% |
| Nicaraguans | 0.0 /100 | #304 | Tragic 2.9% |
| Ecuadorians | 0.0 /100 | #305 | Tragic 3.0% |
| Belizeans | 0.0 /100 | #306 | Tragic 3.0% |
| Immigrants | Haiti | 0.0 /100 | #307 | Tragic 3.0% |
| Immigrants | Somalia | 0.0 /100 | #308 | Tragic 3.0% |
| Hispanics or Latinos | 0.0 /100 | #309 | Tragic 3.0% |
| Guyanese | 0.0 /100 | #310 | Tragic 3.0% |
| Immigrants | Azores | 0.0 /100 | #311 | Tragic 3.0% |
| Sri Lankans | 0.0 /100 | #312 | Tragic 3.0% |
| Hondurans | 0.0 /100 | #313 | Tragic 3.1% |
Demographics Similar to Immigrants from Saudi Arabia by No Schooling Completed
In terms of no schooling completed, the demographic groups most similar to Immigrants from Saudi Arabia are Immigrants from Latvia (1.9%, a difference of 0.13%), Immigrants from Japan (1.9%, a difference of 0.28%), Okinawan (1.8%, a difference of 0.35%), Pueblo (1.9%, a difference of 0.47%), and Yugoslavian (1.8%, a difference of 0.57%).
| Demographics | Rating | Rank | No Schooling Completed |
| Immigrants | Switzerland | 97.9 /100 | #102 | Exceptional 1.8% |
| Basques | 97.9 /100 | #103 | Exceptional 1.8% |
| Thais | 97.5 /100 | #104 | Exceptional 1.8% |
| German Russians | 97.5 /100 | #105 | Exceptional 1.8% |
| Immigrants | France | 97.3 /100 | #106 | Exceptional 1.8% |
| Yugoslavians | 97.2 /100 | #107 | Exceptional 1.8% |
| Okinawans | 97.1 /100 | #108 | Exceptional 1.8% |
| Immigrants | Saudi Arabia | 96.8 /100 | #109 | Exceptional 1.9% |
| Immigrants | Latvia | 96.7 /100 | #110 | Exceptional 1.9% |
| Immigrants | Japan | 96.6 /100 | #111 | Exceptional 1.9% |
| Pueblo | 96.4 /100 | #112 | Exceptional 1.9% |
| Immigrants | Zimbabwe | 96.2 /100 | #113 | Exceptional 1.9% |
| Immigrants | Norway | 96.1 /100 | #114 | Exceptional 1.9% |
| Syrians | 96.0 /100 | #115 | Exceptional 1.9% |
| Lebanese | 96.0 /100 | #116 | Exceptional 1.9% |