Albanian vs Somali Associate's Degree
COMPARE
Albanian
Somali
Associate's Degree
Associate's Degree Comparison
Albanians
Somalis
48.8%
ASSOCIATE'S DEGREE
94.7/ 100
METRIC RATING
118th/ 347
METRIC RANK
46.8%
ASSOCIATE'S DEGREE
62.5/ 100
METRIC RATING
163rd/ 347
METRIC RANK
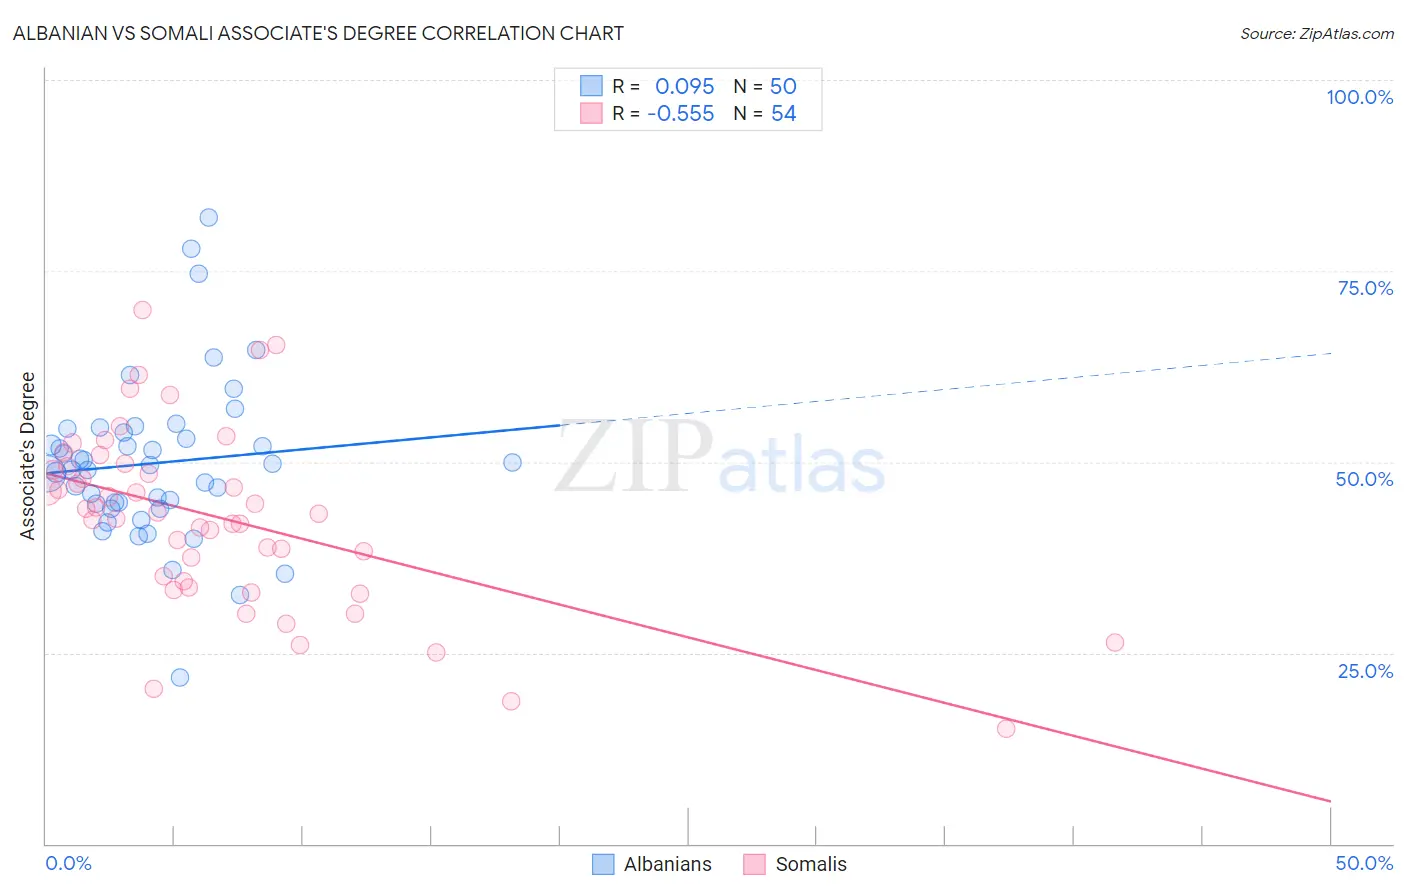
Albanian vs Somali Associate's Degree Correlation Chart
The statistical analysis conducted on geographies consisting of 193,247,791 people shows a slight positive correlation between the proportion of Albanians and percentage of population with at least associate's degree education in the United States with a correlation coefficient (R) of 0.095 and weighted average of 48.8%. Similarly, the statistical analysis conducted on geographies consisting of 99,330,256 people shows a substantial negative correlation between the proportion of Somalis and percentage of population with at least associate's degree education in the United States with a correlation coefficient (R) of -0.555 and weighted average of 46.8%, a difference of 4.4%.
Associate's Degree Correlation Summary
| Measurement | Albanian | Somali |
| Minimum | 21.7% | 15.0% |
| Maximum | 82.0% | 69.9% |
| Range | 60.3% | 54.9% |
| Mean | 49.8% | 42.6% |
| Median | 49.3% | 43.3% |
| Interquartile 25% (IQ1) | 44.6% | 34.4% |
| Interquartile 75% (IQ3) | 53.9% | 49.4% |
| Interquartile Range (IQR) | 9.3% | 15.0% |
| Standard Deviation (Sample) | 10.6% | 11.7% |
| Standard Deviation (Population) | 10.5% | 11.6% |
Similar Demographics by Associate's Degree
Demographics Similar to Albanians by Associate's Degree
In terms of associate's degree, the demographic groups most similar to Albanians are Lebanese (48.8%, a difference of 0.010%), Alsatian (48.8%, a difference of 0.030%), Afghan (48.9%, a difference of 0.060%), British (48.9%, a difference of 0.11%), and Luxembourger (48.9%, a difference of 0.17%).
| Demographics | Rating | Rank | Associate's Degree |
| Immigrants | Venezuela | 95.8 /100 | #111 | Exceptional 49.1% |
| Immigrants | Chile | 95.3 /100 | #112 | Exceptional 49.0% |
| Palestinians | 95.3 /100 | #113 | Exceptional 49.0% |
| Arabs | 95.3 /100 | #114 | Exceptional 49.0% |
| Luxembourgers | 95.1 /100 | #115 | Exceptional 48.9% |
| British | 95.0 /100 | #116 | Exceptional 48.9% |
| Afghans | 94.8 /100 | #117 | Exceptional 48.9% |
| Albanians | 94.7 /100 | #118 | Exceptional 48.8% |
| Lebanese | 94.6 /100 | #119 | Exceptional 48.8% |
| Alsatians | 94.6 /100 | #120 | Exceptional 48.8% |
| Ugandans | 93.9 /100 | #121 | Exceptional 48.7% |
| Italians | 93.9 /100 | #122 | Exceptional 48.7% |
| Brazilians | 93.7 /100 | #123 | Exceptional 48.7% |
| Serbians | 92.6 /100 | #124 | Exceptional 48.5% |
| Chinese | 92.5 /100 | #125 | Exceptional 48.5% |
Demographics Similar to Somalis by Associate's Degree
In terms of associate's degree, the demographic groups most similar to Somalis are Colombian (46.8%, a difference of 0.010%), Immigrants from Africa (46.8%, a difference of 0.060%), Immigrants from South America (46.7%, a difference of 0.21%), Scandinavian (46.9%, a difference of 0.22%), and Scottish (46.9%, a difference of 0.23%).
| Demographics | Rating | Rank | Associate's Degree |
| South Americans | 70.5 /100 | #156 | Good 47.1% |
| Sudanese | 70.3 /100 | #157 | Good 47.1% |
| Immigrants | Germany | 69.7 /100 | #158 | Good 47.1% |
| Immigrants | Poland | 69.2 /100 | #159 | Good 47.1% |
| Scottish | 65.4 /100 | #160 | Good 46.9% |
| Scandinavians | 65.2 /100 | #161 | Good 46.9% |
| Immigrants | Africa | 63.2 /100 | #162 | Good 46.8% |
| Somalis | 62.5 /100 | #163 | Good 46.8% |
| Colombians | 62.4 /100 | #164 | Good 46.8% |
| Immigrants | South America | 59.9 /100 | #165 | Average 46.7% |
| Hungarians | 59.3 /100 | #166 | Average 46.7% |
| Immigrants | Sierra Leone | 59.2 /100 | #167 | Average 46.7% |
| Immigrants | Somalia | 55.5 /100 | #168 | Average 46.5% |
| Uruguayans | 55.4 /100 | #169 | Average 46.5% |
| Irish | 53.6 /100 | #170 | Average 46.5% |