Albanian vs Immigrants from Australia 10th Grade
COMPARE
Albanian
Immigrants from Australia
10th Grade
10th Grade Comparison
Albanians
Immigrants from Australia
94.1%
10TH GRADE
86.5/ 100
METRIC RATING
142nd/ 347
METRIC RANK
94.9%
10TH GRADE
99.7/ 100
METRIC RATING
66th/ 347
METRIC RANK
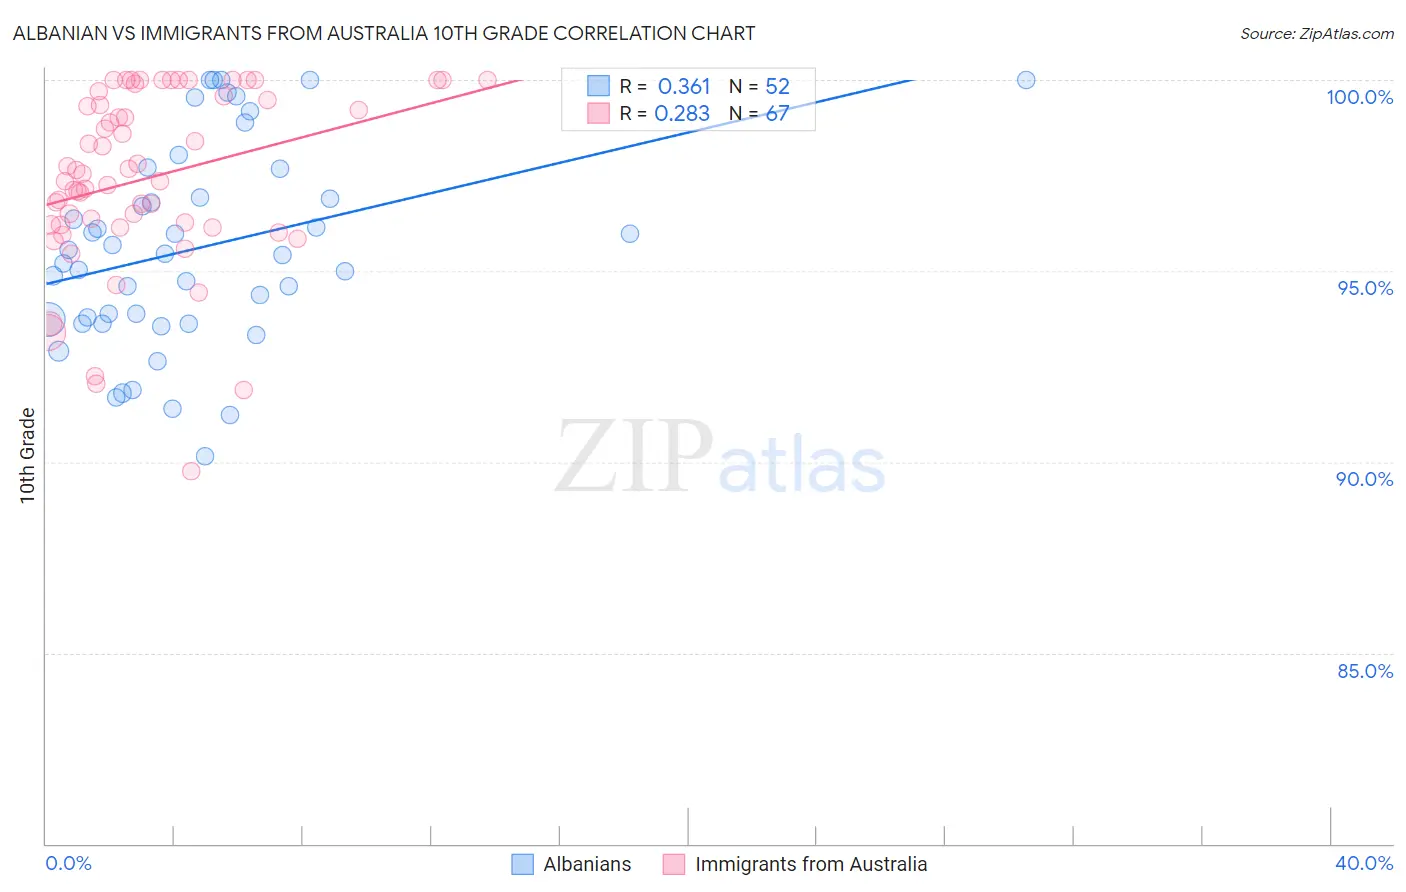
Albanian vs Immigrants from Australia 10th Grade Correlation Chart
The statistical analysis conducted on geographies consisting of 193,265,850 people shows a mild positive correlation between the proportion of Albanians and percentage of population with at least 10th grade education in the United States with a correlation coefficient (R) of 0.361 and weighted average of 94.1%. Similarly, the statistical analysis conducted on geographies consisting of 227,202,695 people shows a weak positive correlation between the proportion of Immigrants from Australia and percentage of population with at least 10th grade education in the United States with a correlation coefficient (R) of 0.283 and weighted average of 94.9%, a difference of 0.85%.
10th Grade Correlation Summary
| Measurement | Albanian | Immigrants from Australia |
| Minimum | 90.1% | 89.8% |
| Maximum | 100.0% | 100.0% |
| Range | 9.9% | 10.2% |
| Mean | 95.6% | 97.4% |
| Median | 95.4% | 97.5% |
| Interquartile 25% (IQ1) | 93.7% | 96.2% |
| Interquartile 75% (IQ3) | 97.3% | 99.6% |
| Interquartile Range (IQR) | 3.6% | 3.4% |
| Standard Deviation (Sample) | 2.6% | 2.3% |
| Standard Deviation (Population) | 2.6% | 2.3% |
Similar Demographics by 10th Grade
Demographics Similar to Albanians by 10th Grade
In terms of 10th grade, the demographic groups most similar to Albanians are Hmong (94.1%, a difference of 0.0%), Immigrants from Jordan (94.1%, a difference of 0.020%), Cherokee (94.1%, a difference of 0.030%), Immigrants from Kazakhstan (94.1%, a difference of 0.030%), and Nonimmigrants (94.1%, a difference of 0.050%).
| Demographics | Rating | Rank | 10th Grade |
| Immigrants | Korea | 91.3 /100 | #135 | Exceptional 94.2% |
| Shoshone | 90.8 /100 | #136 | Exceptional 94.2% |
| Arapaho | 90.5 /100 | #137 | Exceptional 94.2% |
| Immigrants | Sri Lanka | 89.9 /100 | #138 | Excellent 94.2% |
| Immigrants | Bosnia and Herzegovina | 89.4 /100 | #139 | Excellent 94.2% |
| Immigrants | Jordan | 87.6 /100 | #140 | Excellent 94.1% |
| Hmong | 86.6 /100 | #141 | Excellent 94.1% |
| Albanians | 86.5 /100 | #142 | Excellent 94.1% |
| Cherokee | 84.9 /100 | #143 | Excellent 94.1% |
| Immigrants | Kazakhstan | 84.9 /100 | #144 | Excellent 94.1% |
| Immigrants | Nonimmigrants | 83.8 /100 | #145 | Excellent 94.1% |
| Chickasaw | 82.6 /100 | #146 | Excellent 94.1% |
| Immigrants | Ukraine | 81.5 /100 | #147 | Excellent 94.0% |
| Arabs | 80.9 /100 | #148 | Excellent 94.0% |
| Ugandans | 80.7 /100 | #149 | Excellent 94.0% |
Demographics Similar to Immigrants from Australia by 10th Grade
In terms of 10th grade, the demographic groups most similar to Immigrants from Australia are Immigrants from Netherlands (94.9%, a difference of 0.0%), Immigrants from Belgium (94.9%, a difference of 0.0%), Immigrants from England (94.9%, a difference of 0.020%), Zimbabwean (94.9%, a difference of 0.030%), and Alaska Native (94.9%, a difference of 0.030%).
| Demographics | Rating | Rank | 10th Grade |
| Celtics | 99.8 /100 | #59 | Exceptional 95.0% |
| Cypriots | 99.8 /100 | #60 | Exceptional 95.0% |
| Chippewa | 99.8 /100 | #61 | Exceptional 95.0% |
| Thais | 99.8 /100 | #62 | Exceptional 95.0% |
| Immigrants | Singapore | 99.8 /100 | #63 | Exceptional 95.0% |
| Native Hawaiians | 99.7 /100 | #64 | Exceptional 95.0% |
| Turks | 99.7 /100 | #65 | Exceptional 95.0% |
| Immigrants | Australia | 99.7 /100 | #66 | Exceptional 94.9% |
| Immigrants | Netherlands | 99.7 /100 | #67 | Exceptional 94.9% |
| Immigrants | Belgium | 99.7 /100 | #68 | Exceptional 94.9% |
| Immigrants | England | 99.6 /100 | #69 | Exceptional 94.9% |
| Zimbabweans | 99.6 /100 | #70 | Exceptional 94.9% |
| Alaska Natives | 99.6 /100 | #71 | Exceptional 94.9% |
| Immigrants | Sweden | 99.6 /100 | #72 | Exceptional 94.9% |
| Bhutanese | 99.6 /100 | #73 | Exceptional 94.9% |