Albanian vs Immigrants from Philippines Associate's Degree
COMPARE
Albanian
Immigrants from Philippines
Associate's Degree
Associate's Degree Comparison
Albanians
Immigrants from Philippines
48.8%
ASSOCIATE'S DEGREE
94.7/ 100
METRIC RATING
118th/ 347
METRIC RANK
45.0%
ASSOCIATE'S DEGREE
16.7/ 100
METRIC RATING
210th/ 347
METRIC RANK
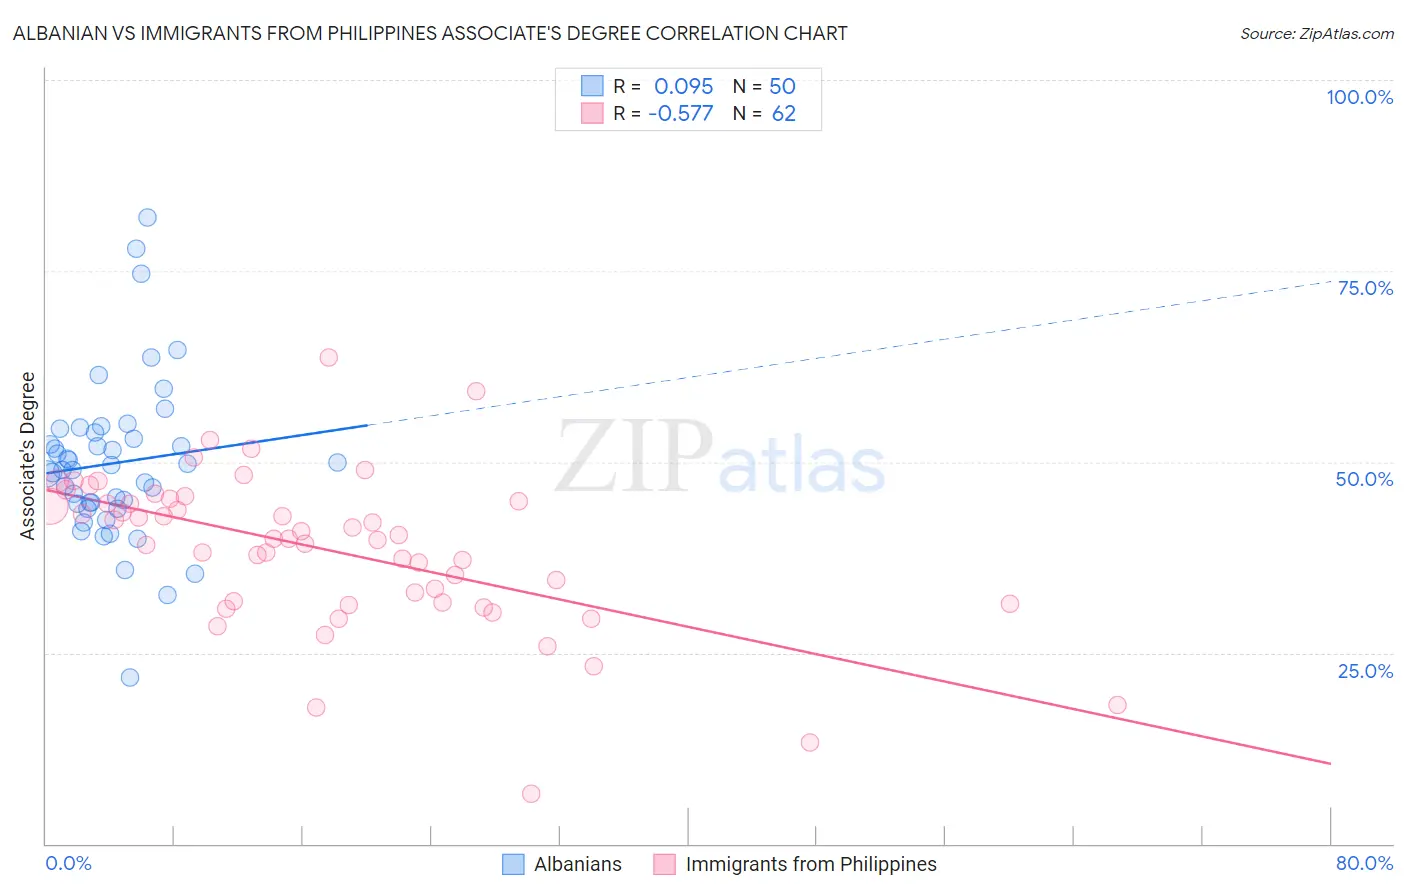
Albanian vs Immigrants from Philippines Associate's Degree Correlation Chart
The statistical analysis conducted on geographies consisting of 193,247,791 people shows a slight positive correlation between the proportion of Albanians and percentage of population with at least associate's degree education in the United States with a correlation coefficient (R) of 0.095 and weighted average of 48.8%. Similarly, the statistical analysis conducted on geographies consisting of 471,293,410 people shows a substantial negative correlation between the proportion of Immigrants from Philippines and percentage of population with at least associate's degree education in the United States with a correlation coefficient (R) of -0.577 and weighted average of 45.0%, a difference of 8.6%.
Associate's Degree Correlation Summary
| Measurement | Albanian | Immigrants from Philippines |
| Minimum | 21.7% | 6.5% |
| Maximum | 82.0% | 63.7% |
| Range | 60.3% | 57.2% |
| Mean | 49.8% | 38.5% |
| Median | 49.3% | 39.9% |
| Interquartile 25% (IQ1) | 44.6% | 31.5% |
| Interquartile 75% (IQ3) | 53.9% | 44.8% |
| Interquartile Range (IQR) | 9.3% | 13.3% |
| Standard Deviation (Sample) | 10.6% | 10.2% |
| Standard Deviation (Population) | 10.5% | 10.2% |
Similar Demographics by Associate's Degree
Demographics Similar to Albanians by Associate's Degree
In terms of associate's degree, the demographic groups most similar to Albanians are Lebanese (48.8%, a difference of 0.010%), Alsatian (48.8%, a difference of 0.030%), Afghan (48.9%, a difference of 0.060%), British (48.9%, a difference of 0.11%), and Luxembourger (48.9%, a difference of 0.17%).
| Demographics | Rating | Rank | Associate's Degree |
| Immigrants | Venezuela | 95.8 /100 | #111 | Exceptional 49.1% |
| Immigrants | Chile | 95.3 /100 | #112 | Exceptional 49.0% |
| Palestinians | 95.3 /100 | #113 | Exceptional 49.0% |
| Arabs | 95.3 /100 | #114 | Exceptional 49.0% |
| Luxembourgers | 95.1 /100 | #115 | Exceptional 48.9% |
| British | 95.0 /100 | #116 | Exceptional 48.9% |
| Afghans | 94.8 /100 | #117 | Exceptional 48.9% |
| Albanians | 94.7 /100 | #118 | Exceptional 48.8% |
| Lebanese | 94.6 /100 | #119 | Exceptional 48.8% |
| Alsatians | 94.6 /100 | #120 | Exceptional 48.8% |
| Ugandans | 93.9 /100 | #121 | Exceptional 48.7% |
| Italians | 93.9 /100 | #122 | Exceptional 48.7% |
| Brazilians | 93.7 /100 | #123 | Exceptional 48.7% |
| Serbians | 92.6 /100 | #124 | Exceptional 48.5% |
| Chinese | 92.5 /100 | #125 | Exceptional 48.5% |
Demographics Similar to Immigrants from Philippines by Associate's Degree
In terms of associate's degree, the demographic groups most similar to Immigrants from Philippines are Immigrants from Costa Rica (45.0%, a difference of 0.010%), Immigrants from Zaire (45.0%, a difference of 0.010%), Dutch (45.0%, a difference of 0.12%), Panamanian (45.1%, a difference of 0.22%), and French Canadian (44.9%, a difference of 0.24%).
| Demographics | Rating | Rank | Associate's Degree |
| Immigrants | South Eastern Asia | 20.2 /100 | #203 | Fair 45.2% |
| Nigerians | 19.1 /100 | #204 | Poor 45.1% |
| Immigrants | Thailand | 18.9 /100 | #205 | Poor 45.1% |
| German Russians | 18.9 /100 | #206 | Poor 45.1% |
| Panamanians | 18.4 /100 | #207 | Poor 45.1% |
| Dutch | 17.6 /100 | #208 | Poor 45.0% |
| Immigrants | Costa Rica | 16.7 /100 | #209 | Poor 45.0% |
| Immigrants | Philippines | 16.7 /100 | #210 | Poor 45.0% |
| Immigrants | Zaire | 16.6 /100 | #211 | Poor 45.0% |
| French Canadians | 15.0 /100 | #212 | Poor 44.9% |
| Immigrants | Ghana | 14.2 /100 | #213 | Poor 44.8% |
| Immigrants | Middle Africa | 12.7 /100 | #214 | Poor 44.7% |
| Immigrants | Panama | 12.4 /100 | #215 | Poor 44.7% |
| Immigrants | Nigeria | 11.4 /100 | #216 | Poor 44.6% |
| Immigrants | Immigrants | 10.5 /100 | #217 | Poor 44.5% |