Albanian vs Immigrants from Iraq 9th Grade
COMPARE
Albanian
Immigrants from Iraq
9th Grade
9th Grade Comparison
Albanians
Immigrants from Iraq
95.1%
9TH GRADE
76.1/ 100
METRIC RATING
153rd/ 347
METRIC RANK
94.9%
9TH GRADE
47.8/ 100
METRIC RATING
177th/ 347
METRIC RANK
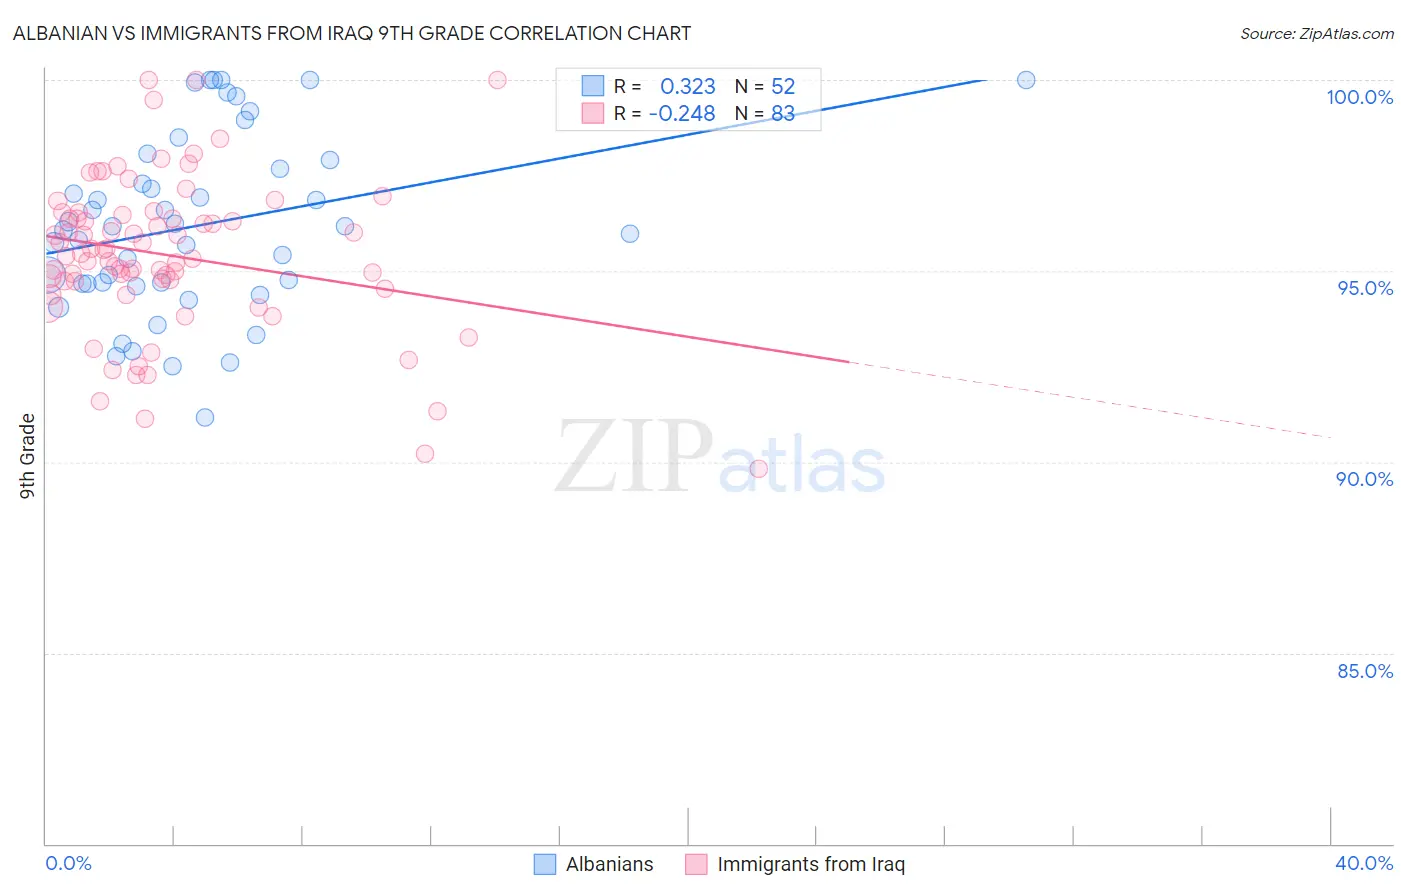
Albanian vs Immigrants from Iraq 9th Grade Correlation Chart
The statistical analysis conducted on geographies consisting of 193,265,850 people shows a mild positive correlation between the proportion of Albanians and percentage of population with at least 9th grade education in the United States with a correlation coefficient (R) of 0.323 and weighted average of 95.1%. Similarly, the statistical analysis conducted on geographies consisting of 194,632,332 people shows a weak negative correlation between the proportion of Immigrants from Iraq and percentage of population with at least 9th grade education in the United States with a correlation coefficient (R) of -0.248 and weighted average of 94.9%, a difference of 0.23%.
9th Grade Correlation Summary
| Measurement | Albanian | Immigrants from Iraq |
| Minimum | 91.2% | 89.8% |
| Maximum | 100.0% | 100.0% |
| Range | 8.8% | 10.2% |
| Mean | 96.2% | 95.4% |
| Median | 96.1% | 95.4% |
| Interquartile 25% (IQ1) | 94.7% | 94.7% |
| Interquartile 75% (IQ3) | 97.8% | 96.5% |
| Interquartile Range (IQR) | 3.1% | 1.7% |
| Standard Deviation (Sample) | 2.3% | 2.0% |
| Standard Deviation (Population) | 2.3% | 2.0% |
Similar Demographics by 9th Grade
Demographics Similar to Albanians by 9th Grade
In terms of 9th grade, the demographic groups most similar to Albanians are Cajun (95.1%, a difference of 0.010%), Ugandan (95.1%, a difference of 0.010%), Arab (95.1%, a difference of 0.010%), Immigrants from Kazakhstan (95.1%, a difference of 0.010%), and Kenyan (95.1%, a difference of 0.030%).
| Demographics | Rating | Rank | 9th Grade |
| Immigrants | Sri Lanka | 82.1 /100 | #146 | Excellent 95.1% |
| Choctaw | 81.9 /100 | #147 | Excellent 95.1% |
| Immigrants | Jordan | 81.2 /100 | #148 | Excellent 95.1% |
| Immigrants | Korea | 79.6 /100 | #149 | Good 95.1% |
| Kenyans | 79.1 /100 | #150 | Good 95.1% |
| Cajuns | 77.3 /100 | #151 | Good 95.1% |
| Ugandans | 77.0 /100 | #152 | Good 95.1% |
| Albanians | 76.1 /100 | #153 | Good 95.1% |
| Arabs | 74.9 /100 | #154 | Good 95.1% |
| Immigrants | Kazakhstan | 74.7 /100 | #155 | Good 95.1% |
| Immigrants | Kenya | 73.1 /100 | #156 | Good 95.0% |
| Mongolians | 73.0 /100 | #157 | Good 95.0% |
| Egyptians | 70.1 /100 | #158 | Good 95.0% |
| Immigrants | Ukraine | 67.4 /100 | #159 | Good 95.0% |
| Immigrants | Italy | 66.6 /100 | #160 | Good 95.0% |
Demographics Similar to Immigrants from Iraq by 9th Grade
In terms of 9th grade, the demographic groups most similar to Immigrants from Iraq are Brazilian (94.9%, a difference of 0.010%), Immigrants from Spain (94.9%, a difference of 0.010%), Immigrants from Poland (94.9%, a difference of 0.010%), Immigrants from Venezuela (94.9%, a difference of 0.010%), and Immigrants from Egypt (94.9%, a difference of 0.020%).
| Demographics | Rating | Rank | 9th Grade |
| Alsatians | 58.6 /100 | #170 | Average 94.9% |
| Colville | 58.5 /100 | #171 | Average 94.9% |
| Iraqis | 54.0 /100 | #172 | Average 94.9% |
| Cheyenne | 51.5 /100 | #173 | Average 94.9% |
| Immigrants | Egypt | 50.0 /100 | #174 | Average 94.9% |
| Brazilians | 49.8 /100 | #175 | Average 94.9% |
| Immigrants | Spain | 49.1 /100 | #176 | Average 94.9% |
| Immigrants | Iraq | 47.8 /100 | #177 | Average 94.9% |
| Immigrants | Poland | 46.7 /100 | #178 | Average 94.9% |
| Immigrants | Venezuela | 46.5 /100 | #179 | Average 94.9% |
| Immigrants | Uganda | 43.1 /100 | #180 | Average 94.8% |
| Sierra Leoneans | 42.7 /100 | #181 | Average 94.8% |
| Seminole | 42.5 /100 | #182 | Average 94.8% |
| Immigrants | Nepal | 39.7 /100 | #183 | Fair 94.8% |
| Argentineans | 37.6 /100 | #184 | Fair 94.8% |