Albanian vs Fijian 9th Grade
COMPARE
Albanian
Fijian
9th Grade
9th Grade Comparison
Albanians
Fijians
95.1%
9TH GRADE
76.1/ 100
METRIC RATING
153rd/ 347
METRIC RANK
93.1%
9TH GRADE
0.0/ 100
METRIC RATING
297th/ 347
METRIC RANK
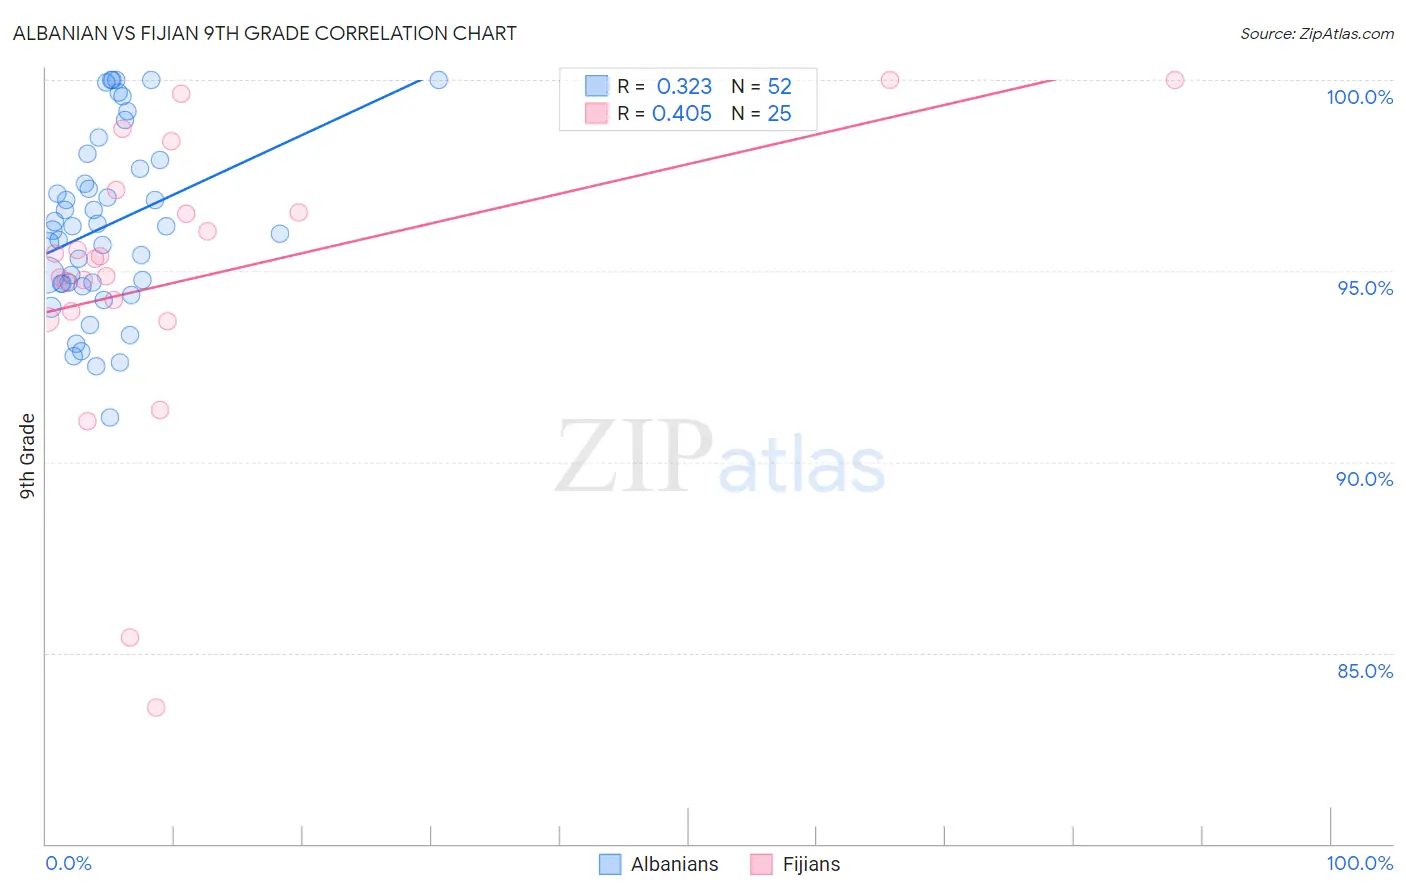
Albanian vs Fijian 9th Grade Correlation Chart
The statistical analysis conducted on geographies consisting of 193,265,850 people shows a mild positive correlation between the proportion of Albanians and percentage of population with at least 9th grade education in the United States with a correlation coefficient (R) of 0.323 and weighted average of 95.1%. Similarly, the statistical analysis conducted on geographies consisting of 55,948,842 people shows a moderate positive correlation between the proportion of Fijians and percentage of population with at least 9th grade education in the United States with a correlation coefficient (R) of 0.405 and weighted average of 93.1%, a difference of 2.1%.
9th Grade Correlation Summary
| Measurement | Albanian | Fijian |
| Minimum | 91.2% | 83.6% |
| Maximum | 100.0% | 100.0% |
| Range | 8.8% | 16.4% |
| Mean | 96.2% | 94.8% |
| Median | 96.1% | 95.3% |
| Interquartile 25% (IQ1) | 94.7% | 93.8% |
| Interquartile 75% (IQ3) | 97.8% | 96.8% |
| Interquartile Range (IQR) | 3.1% | 3.0% |
| Standard Deviation (Sample) | 2.3% | 3.9% |
| Standard Deviation (Population) | 2.3% | 3.8% |
Similar Demographics by 9th Grade
Demographics Similar to Albanians by 9th Grade
In terms of 9th grade, the demographic groups most similar to Albanians are Cajun (95.1%, a difference of 0.010%), Ugandan (95.1%, a difference of 0.010%), Arab (95.1%, a difference of 0.010%), Immigrants from Kazakhstan (95.1%, a difference of 0.010%), and Kenyan (95.1%, a difference of 0.030%).
| Demographics | Rating | Rank | 9th Grade |
| Immigrants | Sri Lanka | 82.1 /100 | #146 | Excellent 95.1% |
| Choctaw | 81.9 /100 | #147 | Excellent 95.1% |
| Immigrants | Jordan | 81.2 /100 | #148 | Excellent 95.1% |
| Immigrants | Korea | 79.6 /100 | #149 | Good 95.1% |
| Kenyans | 79.1 /100 | #150 | Good 95.1% |
| Cajuns | 77.3 /100 | #151 | Good 95.1% |
| Ugandans | 77.0 /100 | #152 | Good 95.1% |
| Albanians | 76.1 /100 | #153 | Good 95.1% |
| Arabs | 74.9 /100 | #154 | Good 95.1% |
| Immigrants | Kazakhstan | 74.7 /100 | #155 | Good 95.1% |
| Immigrants | Kenya | 73.1 /100 | #156 | Good 95.0% |
| Mongolians | 73.0 /100 | #157 | Good 95.0% |
| Egyptians | 70.1 /100 | #158 | Good 95.0% |
| Immigrants | Ukraine | 67.4 /100 | #159 | Good 95.0% |
| Immigrants | Italy | 66.6 /100 | #160 | Good 95.0% |
Demographics Similar to Fijians by 9th Grade
In terms of 9th grade, the demographic groups most similar to Fijians are Immigrants from Burma/Myanmar (93.1%, a difference of 0.030%), Indonesian (93.1%, a difference of 0.030%), Haitian (93.1%, a difference of 0.030%), Cuban (93.2%, a difference of 0.050%), and Sri Lankan (93.2%, a difference of 0.060%).
| Demographics | Rating | Rank | 9th Grade |
| Pennsylvania Germans | 0.0 /100 | #290 | Tragic 93.3% |
| British West Indians | 0.0 /100 | #291 | Tragic 93.2% |
| Immigrants | Laos | 0.0 /100 | #292 | Tragic 93.2% |
| Sri Lankans | 0.0 /100 | #293 | Tragic 93.2% |
| Cubans | 0.0 /100 | #294 | Tragic 93.2% |
| Immigrants | Burma/Myanmar | 0.0 /100 | #295 | Tragic 93.1% |
| Indonesians | 0.0 /100 | #296 | Tragic 93.1% |
| Fijians | 0.0 /100 | #297 | Tragic 93.1% |
| Haitians | 0.0 /100 | #298 | Tragic 93.1% |
| Immigrants | Grenada | 0.0 /100 | #299 | Tragic 93.0% |
| Yaqui | 0.0 /100 | #300 | Tragic 92.9% |
| Immigrants | Haiti | 0.0 /100 | #301 | Tragic 92.7% |
| Immigrants | Dominica | 0.0 /100 | #302 | Tragic 92.7% |
| Guyanese | 0.0 /100 | #303 | Tragic 92.7% |
| Tohono O'odham | 0.0 /100 | #304 | Tragic 92.6% |