Pennsylvania German vs Cree 9th Grade
COMPARE
Pennsylvania German
Cree
9th Grade
9th Grade Comparison
Pennsylvania Germans
Cree
93.3%
9TH GRADE
0.0/ 100
METRIC RATING
290th/ 347
METRIC RANK
95.4%
9TH GRADE
95.5/ 100
METRIC RATING
121st/ 347
METRIC RANK
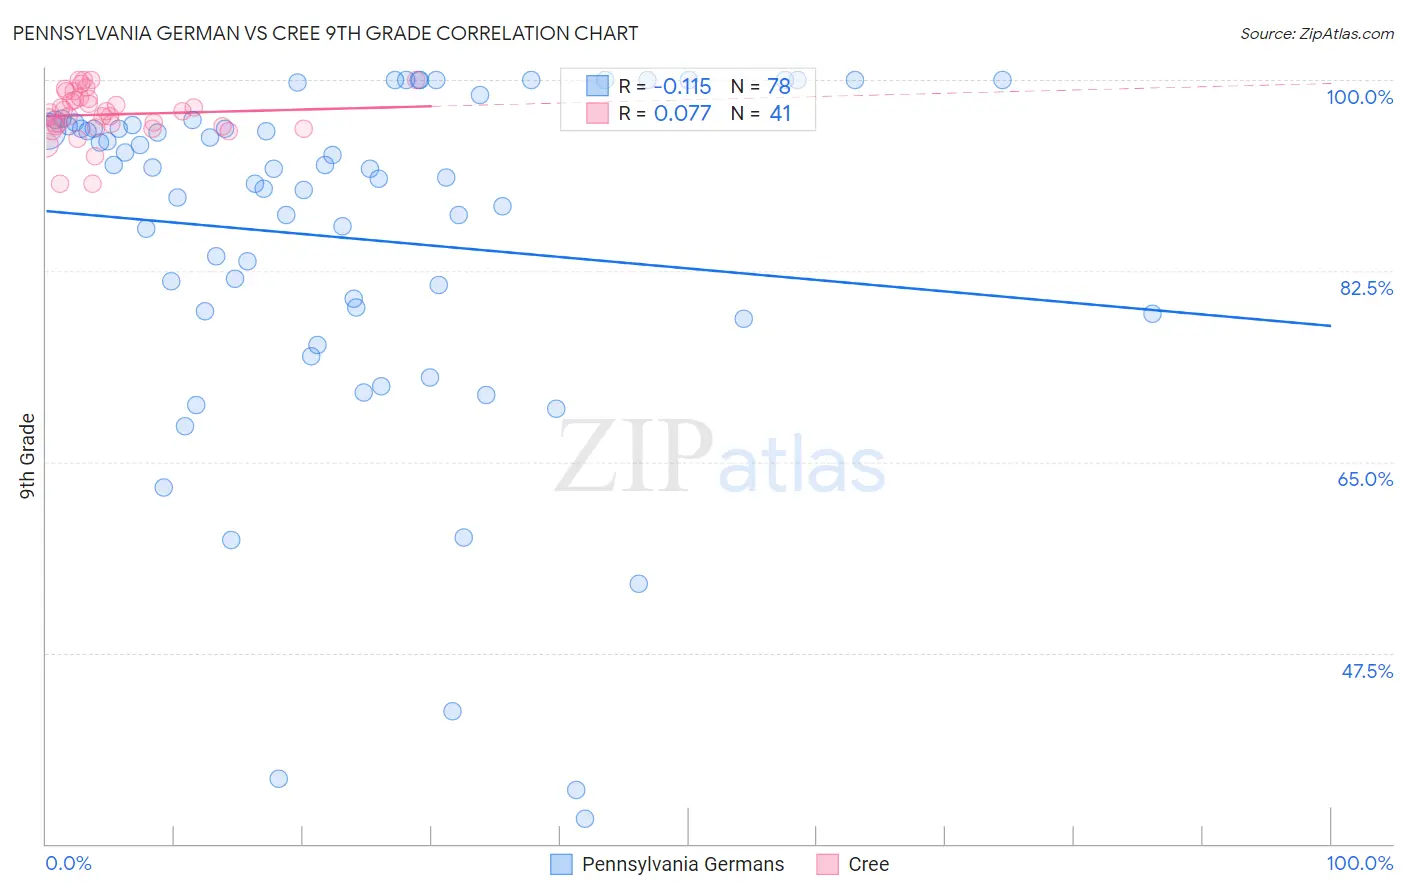
Pennsylvania German vs Cree 9th Grade Correlation Chart
The statistical analysis conducted on geographies consisting of 234,103,120 people shows a poor negative correlation between the proportion of Pennsylvania Germans and percentage of population with at least 9th grade education in the United States with a correlation coefficient (R) of -0.115 and weighted average of 93.3%. Similarly, the statistical analysis conducted on geographies consisting of 76,211,744 people shows a slight positive correlation between the proportion of Cree and percentage of population with at least 9th grade education in the United States with a correlation coefficient (R) of 0.077 and weighted average of 95.4%, a difference of 2.3%.
9th Grade Correlation Summary
| Measurement | Pennsylvania German | Cree |
| Minimum | 32.3% | 90.4% |
| Maximum | 100.0% | 100.0% |
| Range | 67.7% | 9.6% |
| Mean | 85.5% | 96.8% |
| Median | 91.9% | 97.1% |
| Interquartile 25% (IQ1) | 78.8% | 95.7% |
| Interquartile 75% (IQ3) | 95.8% | 98.3% |
| Interquartile Range (IQR) | 17.0% | 2.6% |
| Standard Deviation (Sample) | 16.2% | 2.2% |
| Standard Deviation (Population) | 16.1% | 2.2% |
Similar Demographics by 9th Grade
Demographics Similar to Pennsylvania Germans by 9th Grade
In terms of 9th grade, the demographic groups most similar to Pennsylvania Germans are Immigrants from West Indies (93.3%, a difference of 0.0%), Immigrants from South Eastern Asia (93.3%, a difference of 0.070%), British West Indian (93.2%, a difference of 0.080%), Immigrants from Barbados (93.4%, a difference of 0.10%), and Immigrants from St. Vincent and the Grenadines (93.4%, a difference of 0.10%).
| Demographics | Rating | Rank | 9th Grade |
| Barbadians | 0.0 /100 | #283 | Tragic 93.5% |
| Bangladeshis | 0.0 /100 | #284 | Tragic 93.4% |
| Immigrants | Peru | 0.0 /100 | #285 | Tragic 93.4% |
| Immigrants | Barbados | 0.0 /100 | #286 | Tragic 93.4% |
| Immigrants | St. Vincent and the Grenadines | 0.0 /100 | #287 | Tragic 93.4% |
| Immigrants | South Eastern Asia | 0.0 /100 | #288 | Tragic 93.3% |
| Immigrants | West Indies | 0.0 /100 | #289 | Tragic 93.3% |
| Pennsylvania Germans | 0.0 /100 | #290 | Tragic 93.3% |
| British West Indians | 0.0 /100 | #291 | Tragic 93.2% |
| Immigrants | Laos | 0.0 /100 | #292 | Tragic 93.2% |
| Sri Lankans | 0.0 /100 | #293 | Tragic 93.2% |
| Cubans | 0.0 /100 | #294 | Tragic 93.2% |
| Immigrants | Burma/Myanmar | 0.0 /100 | #295 | Tragic 93.1% |
| Indonesians | 0.0 /100 | #296 | Tragic 93.1% |
| Fijians | 0.0 /100 | #297 | Tragic 93.1% |
Demographics Similar to Cree by 9th Grade
In terms of 9th grade, the demographic groups most similar to Cree are Immigrants from Romania (95.4%, a difference of 0.0%), Immigrants from Turkey (95.4%, a difference of 0.0%), Soviet Union (95.4%, a difference of 0.0%), Cambodian (95.4%, a difference of 0.0%), and Immigrants from Kuwait (95.4%, a difference of 0.0%).
| Demographics | Rating | Rank | 9th Grade |
| German Russians | 96.1 /100 | #114 | Exceptional 95.4% |
| Burmese | 96.0 /100 | #115 | Exceptional 95.4% |
| Immigrants | Europe | 95.7 /100 | #116 | Exceptional 95.4% |
| Immigrants | Romania | 95.6 /100 | #117 | Exceptional 95.4% |
| Immigrants | Turkey | 95.6 /100 | #118 | Exceptional 95.4% |
| Soviet Union | 95.6 /100 | #119 | Exceptional 95.4% |
| Cambodians | 95.6 /100 | #120 | Exceptional 95.4% |
| Cree | 95.5 /100 | #121 | Exceptional 95.4% |
| Immigrants | Kuwait | 95.5 /100 | #122 | Exceptional 95.4% |
| Kiowa | 95.3 /100 | #123 | Exceptional 95.4% |
| Shoshone | 95.3 /100 | #124 | Exceptional 95.4% |
| Immigrants | South Central Asia | 95.1 /100 | #125 | Exceptional 95.4% |
| Immigrants | Serbia | 94.4 /100 | #126 | Exceptional 95.4% |
| Palestinians | 94.3 /100 | #127 | Exceptional 95.4% |
| Immigrants | Hungary | 94.2 /100 | #128 | Exceptional 95.4% |