Immigrants from Ireland vs Nigerian 10th Grade
COMPARE
Immigrants from Ireland
Nigerian
10th Grade
10th Grade Comparison
Immigrants from Ireland
Nigerians
95.0%
10TH GRADE
99.8/ 100
METRIC RATING
55th/ 347
METRIC RANK
93.1%
10TH GRADE
4.2/ 100
METRIC RATING
238th/ 347
METRIC RANK
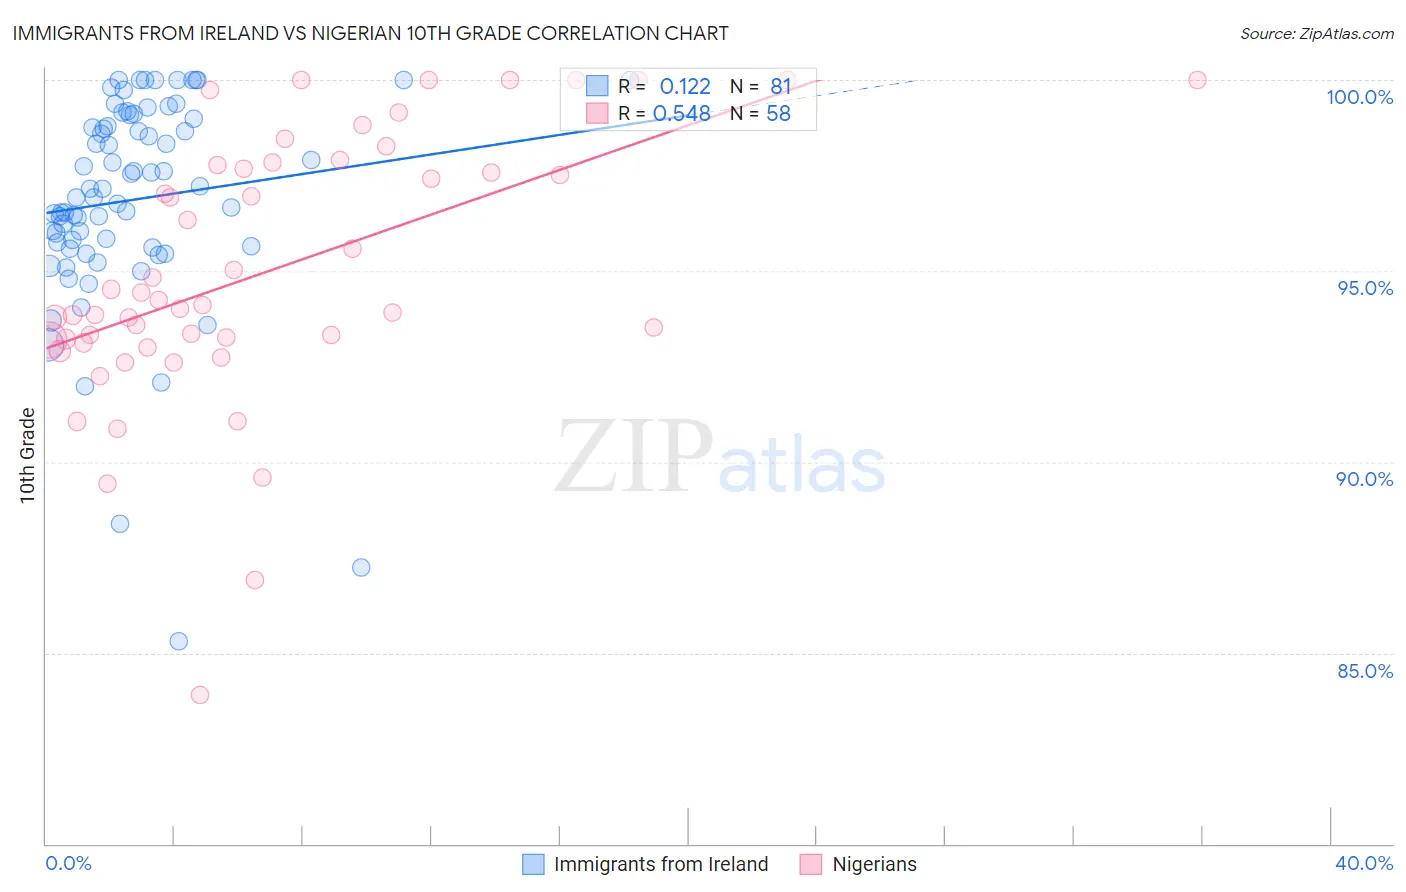
Immigrants from Ireland vs Nigerian 10th Grade Correlation Chart
The statistical analysis conducted on geographies consisting of 240,784,498 people shows a poor positive correlation between the proportion of Immigrants from Ireland and percentage of population with at least 10th grade education in the United States with a correlation coefficient (R) of 0.122 and weighted average of 95.0%. Similarly, the statistical analysis conducted on geographies consisting of 332,724,627 people shows a substantial positive correlation between the proportion of Nigerians and percentage of population with at least 10th grade education in the United States with a correlation coefficient (R) of 0.548 and weighted average of 93.1%, a difference of 2.1%.
10th Grade Correlation Summary
| Measurement | Immigrants from Ireland | Nigerian |
| Minimum | 85.3% | 83.9% |
| Maximum | 100.0% | 100.0% |
| Range | 14.7% | 16.1% |
| Mean | 96.9% | 95.0% |
| Median | 97.1% | 94.2% |
| Interquartile 25% (IQ1) | 95.6% | 93.2% |
| Interquartile 75% (IQ3) | 99.0% | 97.8% |
| Interquartile Range (IQR) | 3.4% | 4.6% |
| Standard Deviation (Sample) | 2.8% | 3.5% |
| Standard Deviation (Population) | 2.8% | 3.4% |
Similar Demographics by 10th Grade
Demographics Similar to Immigrants from Ireland by 10th Grade
In terms of 10th grade, the demographic groups most similar to Immigrants from Ireland are New Zealander (95.0%, a difference of 0.0%), Immigrants from Lithuania (95.0%, a difference of 0.010%), Ukrainian (95.0%, a difference of 0.010%), Aleut (95.0%, a difference of 0.010%), and Celtic (95.0%, a difference of 0.010%).
| Demographics | Rating | Rank | 10th Grade |
| Australians | 99.9 /100 | #48 | Exceptional 95.1% |
| Immigrants | Austria | 99.9 /100 | #49 | Exceptional 95.1% |
| Immigrants | Canada | 99.8 /100 | #50 | Exceptional 95.1% |
| Austrians | 99.8 /100 | #51 | Exceptional 95.1% |
| Ottawa | 99.8 /100 | #52 | Exceptional 95.1% |
| Immigrants | North America | 99.8 /100 | #53 | Exceptional 95.0% |
| Immigrants | Lithuania | 99.8 /100 | #54 | Exceptional 95.0% |
| Immigrants | Ireland | 99.8 /100 | #55 | Exceptional 95.0% |
| New Zealanders | 99.8 /100 | #56 | Exceptional 95.0% |
| Ukrainians | 99.8 /100 | #57 | Exceptional 95.0% |
| Aleuts | 99.8 /100 | #58 | Exceptional 95.0% |
| Celtics | 99.8 /100 | #59 | Exceptional 95.0% |
| Cypriots | 99.8 /100 | #60 | Exceptional 95.0% |
| Chippewa | 99.8 /100 | #61 | Exceptional 95.0% |
| Thais | 99.8 /100 | #62 | Exceptional 95.0% |
Demographics Similar to Nigerians by 10th Grade
In terms of 10th grade, the demographic groups most similar to Nigerians are Costa Rican (93.1%, a difference of 0.0%), Immigrants from Hong Kong (93.1%, a difference of 0.0%), Immigrants from Panama (93.1%, a difference of 0.010%), African (93.1%, a difference of 0.020%), and Afghan (93.1%, a difference of 0.020%).
| Demographics | Rating | Rank | 10th Grade |
| South American Indians | 4.9 /100 | #231 | Tragic 93.1% |
| Bahamians | 4.9 /100 | #232 | Tragic 93.1% |
| Comanche | 4.9 /100 | #233 | Tragic 93.1% |
| Sub-Saharan Africans | 4.7 /100 | #234 | Tragic 93.1% |
| Africans | 4.6 /100 | #235 | Tragic 93.1% |
| Afghans | 4.5 /100 | #236 | Tragic 93.1% |
| Immigrants | Panama | 4.3 /100 | #237 | Tragic 93.1% |
| Nigerians | 4.2 /100 | #238 | Tragic 93.1% |
| Costa Ricans | 4.2 /100 | #239 | Tragic 93.1% |
| Immigrants | Hong Kong | 4.2 /100 | #240 | Tragic 93.1% |
| Immigrants | Somalia | 2.7 /100 | #241 | Tragic 93.0% |
| Immigrants | Cameroon | 2.6 /100 | #242 | Tragic 93.0% |
| Senegalese | 2.4 /100 | #243 | Tragic 93.0% |
| Spanish Americans | 2.1 /100 | #244 | Tragic 92.9% |
| Uruguayans | 1.8 /100 | #245 | Tragic 92.9% |