Immigrants from Scotland vs Nigerian 10th Grade
COMPARE
Immigrants from Scotland
Nigerian
10th Grade
10th Grade Comparison
Immigrants from Scotland
Nigerians
95.2%
10TH GRADE
99.9/ 100
METRIC RATING
39th/ 347
METRIC RANK
93.1%
10TH GRADE
4.2/ 100
METRIC RATING
238th/ 347
METRIC RANK
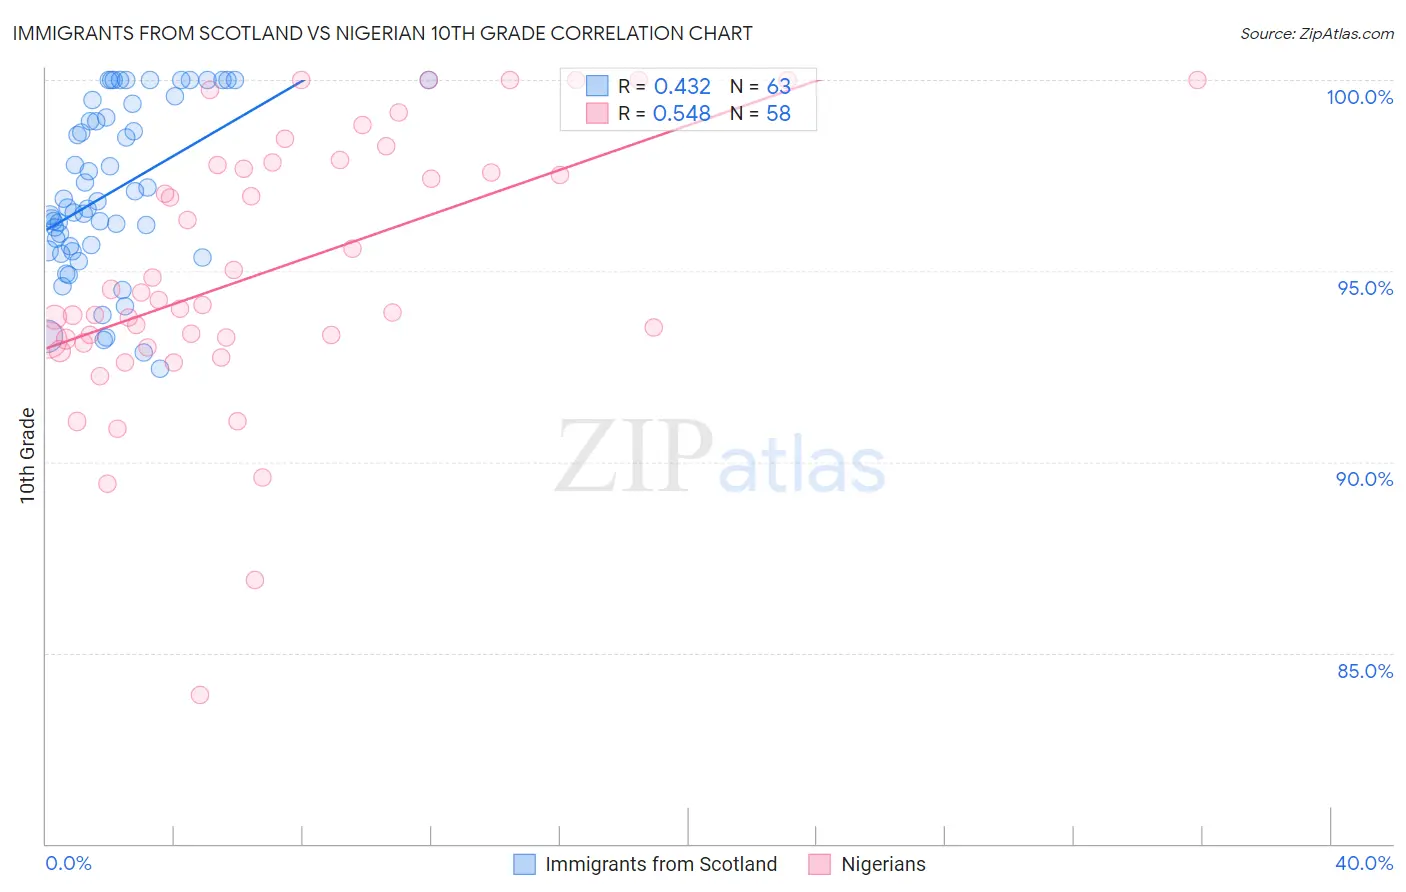
Immigrants from Scotland vs Nigerian 10th Grade Correlation Chart
The statistical analysis conducted on geographies consisting of 196,394,967 people shows a moderate positive correlation between the proportion of Immigrants from Scotland and percentage of population with at least 10th grade education in the United States with a correlation coefficient (R) of 0.432 and weighted average of 95.2%. Similarly, the statistical analysis conducted on geographies consisting of 332,724,627 people shows a substantial positive correlation between the proportion of Nigerians and percentage of population with at least 10th grade education in the United States with a correlation coefficient (R) of 0.548 and weighted average of 93.1%, a difference of 2.3%.
10th Grade Correlation Summary
| Measurement | Immigrants from Scotland | Nigerian |
| Minimum | 92.4% | 83.9% |
| Maximum | 100.0% | 100.0% |
| Range | 7.6% | 16.1% |
| Mean | 97.1% | 95.0% |
| Median | 96.7% | 94.2% |
| Interquartile 25% (IQ1) | 95.5% | 93.2% |
| Interquartile 75% (IQ3) | 99.4% | 97.8% |
| Interquartile Range (IQR) | 3.8% | 4.6% |
| Standard Deviation (Sample) | 2.2% | 3.5% |
| Standard Deviation (Population) | 2.2% | 3.4% |
Similar Demographics by 10th Grade
Demographics Similar to Immigrants from Scotland by 10th Grade
In terms of 10th grade, the demographic groups most similar to Immigrants from Scotland are Scotch-Irish (95.2%, a difference of 0.0%), Northern European (95.3%, a difference of 0.020%), Russian (95.2%, a difference of 0.030%), French Canadian (95.3%, a difference of 0.060%), and Slavic (95.2%, a difference of 0.060%).
| Demographics | Rating | Rank | 10th Grade |
| Hungarians | 100.0 /100 | #32 | Exceptional 95.3% |
| French | 100.0 /100 | #33 | Exceptional 95.3% |
| British | 99.9 /100 | #34 | Exceptional 95.3% |
| Estonians | 99.9 /100 | #35 | Exceptional 95.3% |
| Immigrants | India | 99.9 /100 | #36 | Exceptional 95.3% |
| French Canadians | 99.9 /100 | #37 | Exceptional 95.3% |
| Northern Europeans | 99.9 /100 | #38 | Exceptional 95.3% |
| Immigrants | Scotland | 99.9 /100 | #39 | Exceptional 95.2% |
| Scotch-Irish | 99.9 /100 | #40 | Exceptional 95.2% |
| Russians | 99.9 /100 | #41 | Exceptional 95.2% |
| Slavs | 99.9 /100 | #42 | Exceptional 95.2% |
| Macedonians | 99.9 /100 | #43 | Exceptional 95.2% |
| Immigrants | Northern Europe | 99.9 /100 | #44 | Exceptional 95.2% |
| Greeks | 99.9 /100 | #45 | Exceptional 95.2% |
| Czechoslovakians | 99.9 /100 | #46 | Exceptional 95.1% |
Demographics Similar to Nigerians by 10th Grade
In terms of 10th grade, the demographic groups most similar to Nigerians are Costa Rican (93.1%, a difference of 0.0%), Immigrants from Hong Kong (93.1%, a difference of 0.0%), Immigrants from Panama (93.1%, a difference of 0.010%), African (93.1%, a difference of 0.020%), and Afghan (93.1%, a difference of 0.020%).
| Demographics | Rating | Rank | 10th Grade |
| South American Indians | 4.9 /100 | #231 | Tragic 93.1% |
| Bahamians | 4.9 /100 | #232 | Tragic 93.1% |
| Comanche | 4.9 /100 | #233 | Tragic 93.1% |
| Sub-Saharan Africans | 4.7 /100 | #234 | Tragic 93.1% |
| Africans | 4.6 /100 | #235 | Tragic 93.1% |
| Afghans | 4.5 /100 | #236 | Tragic 93.1% |
| Immigrants | Panama | 4.3 /100 | #237 | Tragic 93.1% |
| Nigerians | 4.2 /100 | #238 | Tragic 93.1% |
| Costa Ricans | 4.2 /100 | #239 | Tragic 93.1% |
| Immigrants | Hong Kong | 4.2 /100 | #240 | Tragic 93.1% |
| Immigrants | Somalia | 2.7 /100 | #241 | Tragic 93.0% |
| Immigrants | Cameroon | 2.6 /100 | #242 | Tragic 93.0% |
| Senegalese | 2.4 /100 | #243 | Tragic 93.0% |
| Spanish Americans | 2.1 /100 | #244 | Tragic 92.9% |
| Uruguayans | 1.8 /100 | #245 | Tragic 92.9% |