Alaskan Athabascan vs Immigrants from Philippines 7th Grade

COMPARE

Alaskan Athabascan
Race
Ancestry
AfghanAfricanAlaska NativeAlaskan AthabascanAlbanianAleutAlsatianAmericanApacheArabArapahoArgentineanArmenianAssyrian/Chaldean/SyriacAustralianAustrianBahamianBangladeshiBarbadianBasqueBelgianBelizeanBermudanBhutaneseBlackfeetBolivianBrazilianBritishBritish West IndianBulgarianBurmeseCajunCambodianCanadianCape VerdeanCarpatho RusynCelticCentral AmericanCentral American IndianCherokeeCheyenneChickasawChileanChineseChippewaChoctawColombianColvilleComancheCosta RicanCreeCreekCroatianCrowCubanCypriotCzechCzechoslovakianDanishDelawareDominicanDutchDutch West IndianEastern EuropeanEcuadorianEgyptianEnglishEstonianEthiopianEuropeanFijianFilipinoFinnishFrenchFrench American IndianFrench CanadianGermanGerman RussianGhanaianGreekGuamanian/ChamorroGuatemalanGuyaneseHaitianHmongHonduranHopiHoumaHungarianIcelanderIndian (Asian)IndonesianInupiatIranianIraqiIrishIroquoisIsraeliItalianJamaicanJapaneseJordanianKenyanKiowaKoreanLaotianLatvianLebaneseLiberianLithuanianLumbeeLuxembourgerMacedonianMalaysianMalteseMarshalleseMenomineeMexicanMexican American IndianMongolianMoroccanNative HawaiianNavajoNepaleseNew ZealanderNicaraguanNigerianNorthern EuropeanNorwegianOkinawanOsageOttawaPaiutePakistaniPalestinianPanamanianParaguayanPennsylvania GermanPeruvianPimaPolishPortuguesePotawatomiPuebloPuerto RicanPuget Sound SalishRomanianRussianSalvadoranSamoanScandinavianScotch-IrishScottishSeminoleSenegaleseSerbianShoshoneSierra LeoneanSiouxSlavicSlovakSloveneSomaliSouth AfricanSouth AmericanSouth American IndianSoviet UnionSpaniardSpanishSpanish AmericanSpanish American IndianSri LankanSubsaharan AfricanSudaneseSwedishSwissSyrianTaiwaneseThaiTlingit-HaidaTohono O'OdhamTonganTrinidadian and TobagonianTsimshianTurkishU.S. Virgin IslanderUgandanUkrainianUruguayanUteVenezuelanVietnameseWelshWest IndianYakamaYaquiYugoslavianYumanYup'ikZimbabwean
Immigration
NonimmigrantsImmigrantsAfghanistanAfricaAlbaniaArgentinaArmeniaAsiaAustraliaAustriaBahamasBangladeshBarbadosBelarusBelgiumBelizeBoliviaBosnia and HerzegovinaBrazilBulgariaBurma/MyanmarCabo VerdeCambodiaCameroonCanadaCaribbeanCentral AmericaChileChinaColombiaCongoCosta RicaCroatiaCubaCzechoslovakiaDenmarkDominicaDominican RepublicEastern AfricaEastern AsiaEastern EuropeEcuadorEgyptEl SalvadorEnglandEritreaEthiopiaEuropeFijiFranceGermanyGhanaGreeceGrenadaGuatemalaGuyanaHaitiHondurasHong KongHungaryIndiaIndonesiaIranIraqIrelandIsraelItalyJamaicaJapanJordanKazakhstanKenyaKoreaKuwaitLaosLatin AmericaLatviaLebanonLiberiaLithuaniaMalaysiaMexicoMicronesiaMiddle AfricaMoldovaMoroccoNepalNetherlandsNicaraguaNigeriaNorth AmericaNorth MacedoniaNorthern AfricaNorthern EuropeNorwayOceaniaPakistanPanamaPeruPolandPortugalRomaniaRussiaSaudi ArabiaScotlandSenegalSerbiaSierra LeoneSingaporeSomaliaSouth AfricaSouth AmericaSouth Central AsiaSouth Eastern AsiaSouthern EuropeSpainSri LankaSt. Vincent and the GrenadinesSudanSwedenSwitzerlandSyriaTaiwanThailandTrinidad and TobagoTurkeyUgandaUkraineUruguayUzbekistanVenezuelaVietnamWest IndiesWestern AfricaWestern AsiaWestern EuropeYemenZaireZimbabweAzores
Immigrants from Philippines
Race
Ancestry
AfghanAfricanAlaska NativeAlbanianAleutAlsatianAmericanApacheArabArapahoArgentineanArmenianAssyrian/Chaldean/SyriacAustralianAustrianBahamianBangladeshiBarbadianBasqueBelgianBelizeanBermudanBhutaneseBlackfeetBolivianBrazilianBritishBritish West IndianBulgarianBurmeseCajunCambodianCanadianCape VerdeanCarpatho RusynCelticCentral AmericanCentral American IndianCherokeeCheyenneChickasawChileanChineseChippewaChoctawColombianColvilleComancheCosta RicanCreeCreekCroatianCrowCubanCypriotCzechCzechoslovakianDanishDelawareDominicanDutchDutch West IndianEastern EuropeanEcuadorianEgyptianEnglishEstonianEthiopianEuropeanFijianFilipinoFinnishFrenchFrench American IndianFrench CanadianGermanGerman RussianGhanaianGreekGuamanian/ChamorroGuatemalanGuyaneseHaitianHmongHonduranHopiHoumaHungarianIcelanderIndian (Asian)IndonesianInupiatIranianIraqiIrishIroquoisIsraeliItalianJamaicanJapaneseJordanianKenyanKiowaKoreanLaotianLatvianLebaneseLiberianLithuanianLumbeeLuxembourgerMacedonianMalaysianMalteseMarshalleseMenomineeMexicanMexican American IndianMongolianMoroccanNative HawaiianNavajoNepaleseNew ZealanderNicaraguanNigerianNorthern EuropeanNorwegianOkinawanOsageOttawaPaiutePakistaniPalestinianPanamanianParaguayanPennsylvania GermanPeruvianPimaPolishPortuguesePotawatomiPuebloPuerto RicanPuget Sound SalishRomanianRussianSalvadoranSamoanScandinavianScotch-IrishScottishSeminoleSenegaleseSerbianShoshoneSierra LeoneanSiouxSlavicSlovakSloveneSomaliSouth AfricanSouth AmericanSouth American IndianSoviet UnionSpaniardSpanishSpanish AmericanSpanish American IndianSri LankanSubsaharan AfricanSudaneseSwedishSwissSyrianTaiwaneseThaiTlingit-HaidaTohono O'OdhamTonganTrinidadian and TobagonianTsimshianTurkishU.S. Virgin IslanderUgandanUkrainianUruguayanUteVenezuelanVietnameseWelshWest IndianYakamaYaquiYugoslavianYumanYup'ikZimbabwean
Immigration
NonimmigrantsImmigrantsAfghanistanAfricaAlbaniaArgentinaArmeniaAsiaAustraliaAustriaBahamasBangladeshBarbadosBelarusBelgiumBelizeBoliviaBosnia and HerzegovinaBrazilBulgariaBurma/MyanmarCabo VerdeCambodiaCameroonCanadaCaribbeanCentral AmericaChileChinaColombiaCongoCosta RicaCroatiaCubaCzechoslovakiaDenmarkDominicaDominican RepublicEastern AfricaEastern AsiaEastern EuropeEcuadorEgyptEl SalvadorEnglandEritreaEthiopiaEuropeFijiFranceGermanyGhanaGreeceGrenadaGuatemalaGuyanaHaitiHondurasHong KongHungaryIndiaIndonesiaIranIraqIrelandIsraelItalyJamaicaJapanJordanKazakhstanKenyaKoreaKuwaitLaosLatin AmericaLatviaLebanonLiberiaLithuaniaMalaysiaMexicoMicronesiaMiddle AfricaMoldovaMoroccoNepalNetherlandsNicaraguaNigeriaNorth AmericaNorth MacedoniaNorthern AfricaNorthern EuropeNorwayOceaniaPakistanPanamaPeruPhilippinesPolandPortugalRomaniaRussiaSaudi ArabiaScotlandSenegalSerbiaSierra LeoneSingaporeSomaliaSouth AfricaSouth AmericaSouth Central AsiaSouth Eastern AsiaSouthern EuropeSpainSri LankaSt. Vincent and the GrenadinesSudanSwedenSwitzerlandSyriaTaiwanThailandTrinidad and TobagoTurkeyUgandaUkraineUruguayUzbekistanVenezuelaVietnamWest IndiesWestern AfricaWestern AsiaWestern EuropeYemenZaireZimbabweAzores
7th Grade
Income
Poverty
Unemployment
Labor Participation
Family Structure
Vehicle Availability
Education Level
Disability

7th Grade Comparison

Alaskan Athabascans

Immigrants from Philippines

Exceptional
Tragic
97.6%
7TH GRADE
100.0/ 100
METRIC RATING
11th/ 347
METRIC RANK
94.9%
7TH GRADE
0.0/ 100
METRIC RATING
286th/ 347
METRIC RANK

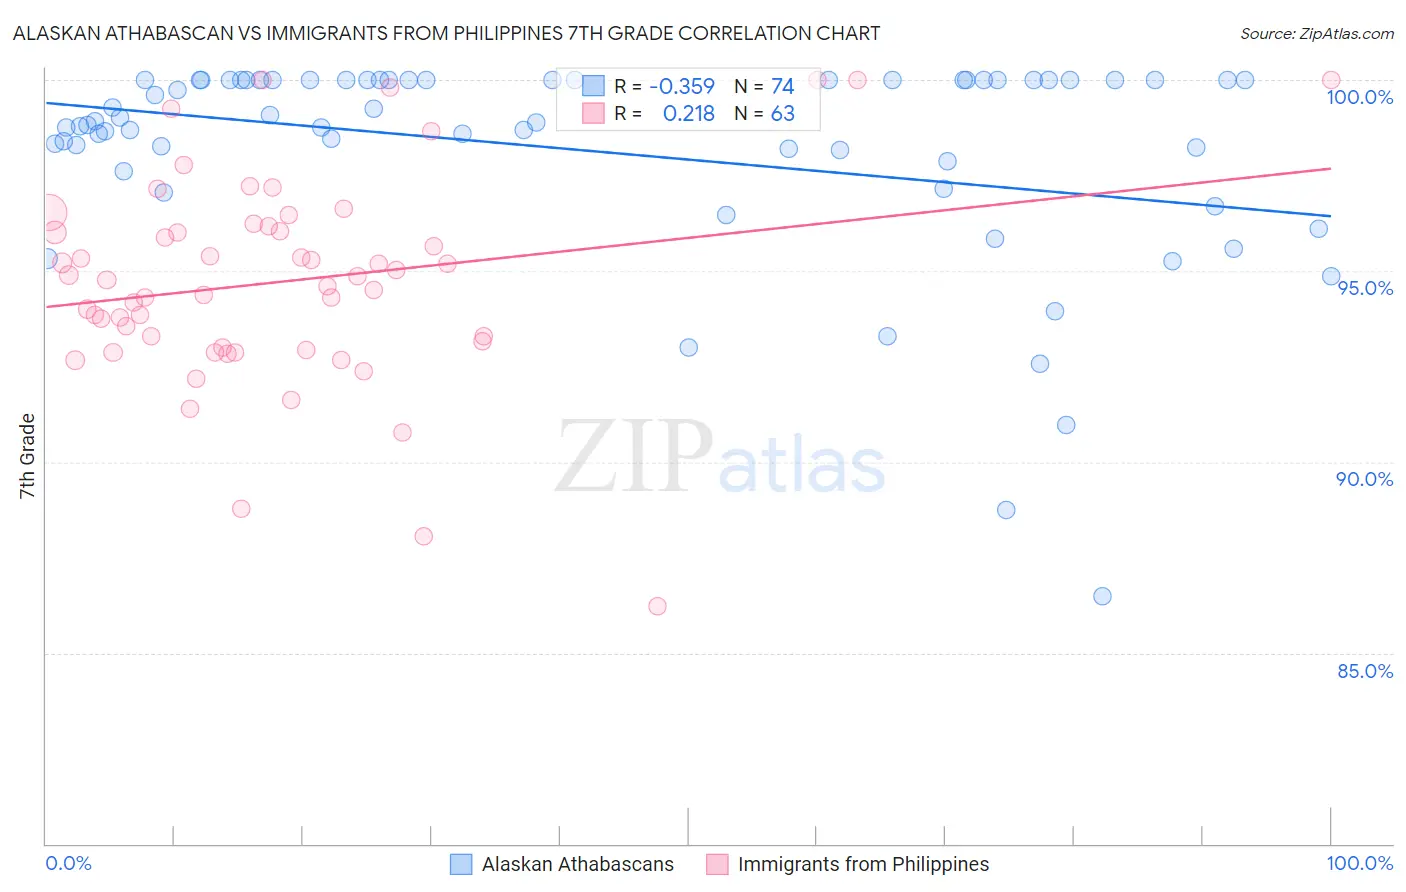
Alaskan Athabascan vs Immigrants from Philippines 7th Grade Correlation Chart

The statistical analysis conducted on geographies consisting of 45,820,365 people shows a mild negative correlation between the proportion of Alaskan Athabascans and percentage of population with at least 7th grade education in the United States with a correlation coefficient (R) of -0.359 and weighted average of 97.6%. Similarly, the statistical analysis conducted on geographies consisting of 471,300,535 people shows a weak positive correlation between the proportion of Immigrants from Philippines and percentage of population with at least 7th grade education in the United States with a correlation coefficient (R) of 0.218 and weighted average of 94.9%, a difference of 2.9%.
Alaskan Athabascan vs Immigrants from Philippines 7th Grade

7th Grade Correlation Summary

MeasurementAlaskan AthabascanImmigrants from Philippines
Minimum86.5%86.2%
Maximum100.0%100.0%
Range13.5%13.8%
Mean98.2%94.7%
Median98.9%94.7%
Interquartile 25% (IQ1)97.9%93.0%
Interquartile 75% (IQ3)100.0%96.2%
Interquartile Range (IQR)2.1%3.2%
Standard Deviation (Sample)2.7%2.7%
Standard Deviation (Population)2.7%2.7%

Similar Demographics by 7th Grade

Demographics Similar to Alaskan Athabascans by 7th Grade

In terms of 7th grade, the demographic groups most similar to Alaskan Athabascans are Slovene (97.6%, a difference of 0.010%), Polish (97.6%, a difference of 0.010%), Swedish (97.6%, a difference of 0.040%), Pennsylvania German (97.6%, a difference of 0.050%), and English (97.6%, a difference of 0.060%).
DemographicsRating | Rank7th Grade
Ottawa
100.0
/100
|
#4
Exceptional
98.1%
Dutch
100.0
/100
|
#5
Exceptional
97.9%
Tsimshian
100.0
/100
|
#6
Exceptional
97.8%
Norwegians
100.0
/100
|
#7
Exceptional
97.8%
Slovaks
100.0
/100
|
#8
Exceptional
97.8%
Germans
100.0
/100
|
#9
Exceptional
97.7%
Slovenes
100.0
/100
|
#10
Exceptional
97.6%
Alaskan Athabascans
100.0
/100
|
#11
Exceptional
97.6%
Poles
100.0
/100
|
#12
Exceptional
97.6%
Swedes
100.0
/100
|
#13
Exceptional
97.6%
Pennsylvania Germans
100.0
/100
|
#14
Exceptional
97.6%
English
100.0
/100
|
#15
Exceptional
97.6%
Irish
100.0
/100
|
#16
Exceptional
97.5%
Scottish
100.0
/100
|
#17
Exceptional
97.5%
Tlingit-Haida
100.0
/100
|
#18
Exceptional
97.5%

Demographics Similar to Immigrants from Philippines by 7th Grade

In terms of 7th grade, the demographic groups most similar to Immigrants from Philippines are Immigrants from Peru (94.9%, a difference of 0.010%), British West Indian (94.8%, a difference of 0.030%), Taiwanese (94.8%, a difference of 0.040%), Malaysian (94.8%, a difference of 0.060%), and Immigrants from Eritrea (94.9%, a difference of 0.080%).
DemographicsRating | Rank7th Grade
Barbadians
0.1
/100
|
#279
Tragic
95.1%
Immigrants | St. Vincent and the Grenadines
0.1
/100
|
#280
Tragic
95.0%
Tohono O'odham
0.1
/100
|
#281
Tragic
95.0%
Immigrants | Bolivia
0.1
/100
|
#282
Tragic
95.0%
Immigrants | Barbados
0.1
/100
|
#283
Tragic
95.0%
Armenians
0.1
/100
|
#284
Tragic
95.0%
Immigrants | Eritrea
0.1
/100
|
#285
Tragic
94.9%
Immigrants | Philippines
0.0
/100
|
#286
Tragic
94.9%
Immigrants | Peru
0.0
/100
|
#287
Tragic
94.9%
British West Indians
0.0
/100
|
#288
Tragic
94.8%
Taiwanese
0.0
/100
|
#289
Tragic
94.8%
Malaysians
0.0
/100
|
#290
Tragic
94.8%
Immigrants | Grenada
0.0
/100
|
#291
Tragic
94.8%
Immigrants | West Indies
0.0
/100
|
#292
Tragic
94.8%
Fijians
0.0
/100
|
#293
Tragic
94.7%