Alaska Native vs Immigrants from Panama Doctorate Degree
COMPARE
Alaska Native
Immigrants from Panama
Doctorate Degree
Doctorate Degree Comparison
Alaska Natives
Immigrants from Panama
1.4%
DOCTORATE DEGREE
0.3/ 100
METRIC RATING
292nd/ 347
METRIC RANK
1.6%
DOCTORATE DEGREE
2.4/ 100
METRIC RATING
240th/ 347
METRIC RANK
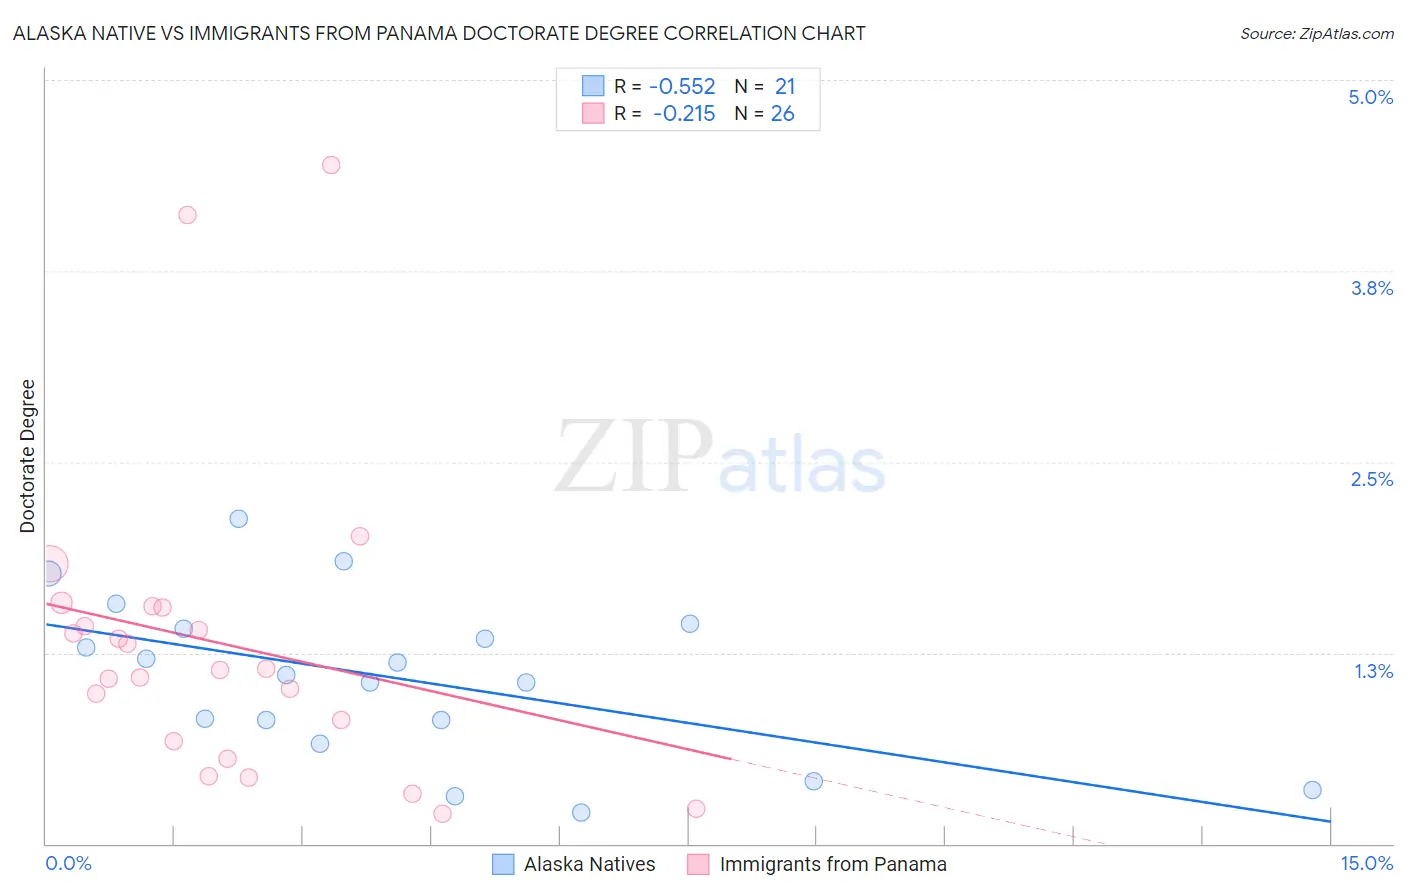
Alaska Native vs Immigrants from Panama Doctorate Degree Correlation Chart
The statistical analysis conducted on geographies consisting of 76,370,977 people shows a substantial negative correlation between the proportion of Alaska Natives and percentage of population with at least doctorate degree education in the United States with a correlation coefficient (R) of -0.552 and weighted average of 1.4%. Similarly, the statistical analysis conducted on geographies consisting of 220,111,742 people shows a weak negative correlation between the proportion of Immigrants from Panama and percentage of population with at least doctorate degree education in the United States with a correlation coefficient (R) of -0.215 and weighted average of 1.6%, a difference of 10.4%.
Doctorate Degree Correlation Summary
| Measurement | Alaska Native | Immigrants from Panama |
| Minimum | 0.21% | 0.20% |
| Maximum | 2.1% | 4.4% |
| Range | 1.9% | 4.2% |
| Mean | 1.1% | 1.3% |
| Median | 1.1% | 1.1% |
| Interquartile 25% (IQ1) | 0.73% | 0.67% |
| Interquartile 75% (IQ3) | 1.4% | 1.5% |
| Interquartile Range (IQR) | 0.69% | 0.88% |
| Standard Deviation (Sample) | 0.53% | 1.0% |
| Standard Deviation (Population) | 0.51% | 0.98% |
Similar Demographics by Doctorate Degree
Demographics Similar to Alaska Natives by Doctorate Degree
In terms of doctorate degree, the demographic groups most similar to Alaska Natives are Black/African American (1.4%, a difference of 0.17%), Choctaw (1.4%, a difference of 0.40%), Cape Verdean (1.4%, a difference of 0.42%), Immigrants from El Salvador (1.4%, a difference of 0.55%), and Immigrants from Yemen (1.4%, a difference of 0.59%).
| Demographics | Rating | Rank | Doctorate Degree |
| Malaysians | 0.3 /100 | #285 | Tragic 1.5% |
| Cherokee | 0.3 /100 | #286 | Tragic 1.5% |
| Cajuns | 0.3 /100 | #287 | Tragic 1.5% |
| Immigrants | El Salvador | 0.3 /100 | #288 | Tragic 1.4% |
| Cape Verdeans | 0.3 /100 | #289 | Tragic 1.4% |
| Choctaw | 0.3 /100 | #290 | Tragic 1.4% |
| Blacks/African Americans | 0.3 /100 | #291 | Tragic 1.4% |
| Alaska Natives | 0.3 /100 | #292 | Tragic 1.4% |
| Immigrants | Yemen | 0.2 /100 | #293 | Tragic 1.4% |
| Samoans | 0.2 /100 | #294 | Tragic 1.4% |
| Guatemalans | 0.2 /100 | #295 | Tragic 1.4% |
| Immigrants | Ecuador | 0.2 /100 | #296 | Tragic 1.4% |
| Tsimshian | 0.2 /100 | #297 | Tragic 1.4% |
| Puerto Ricans | 0.1 /100 | #298 | Tragic 1.4% |
| Belizeans | 0.1 /100 | #299 | Tragic 1.4% |
Demographics Similar to Immigrants from Panama by Doctorate Degree
In terms of doctorate degree, the demographic groups most similar to Immigrants from Panama are West Indian (1.6%, a difference of 0.19%), Cheyenne (1.6%, a difference of 0.19%), Immigrants from Congo (1.6%, a difference of 0.29%), Ottawa (1.6%, a difference of 0.40%), and Iroquois (1.6%, a difference of 0.50%).
| Demographics | Rating | Rank | Doctorate Degree |
| Barbadians | 3.3 /100 | #233 | Tragic 1.6% |
| Hopi | 3.2 /100 | #234 | Tragic 1.6% |
| Cree | 3.0 /100 | #235 | Tragic 1.6% |
| Indonesians | 2.8 /100 | #236 | Tragic 1.6% |
| Iroquois | 2.7 /100 | #237 | Tragic 1.6% |
| Immigrants | Congo | 2.6 /100 | #238 | Tragic 1.6% |
| West Indians | 2.5 /100 | #239 | Tragic 1.6% |
| Immigrants | Panama | 2.4 /100 | #240 | Tragic 1.6% |
| Cheyenne | 2.3 /100 | #241 | Tragic 1.6% |
| Ottawa | 2.2 /100 | #242 | Tragic 1.6% |
| Native Hawaiians | 2.1 /100 | #243 | Tragic 1.6% |
| French American Indians | 2.0 /100 | #244 | Tragic 1.6% |
| Delaware | 1.9 /100 | #245 | Tragic 1.6% |
| Hmong | 1.8 /100 | #246 | Tragic 1.6% |
| Comanche | 1.8 /100 | #247 | Tragic 1.6% |