Immigrants from Cameroon vs Immigrants from Kenya Doctorate Degree
COMPARE
Immigrants from Cameroon
Immigrants from Kenya
Doctorate Degree
Doctorate Degree Comparison
Immigrants from Cameroon
Immigrants from Kenya
2.0%
DOCTORATE DEGREE
88.9/ 100
METRIC RATING
134th/ 347
METRIC RANK
1.9%
DOCTORATE DEGREE
74.3/ 100
METRIC RATING
152nd/ 347
METRIC RANK
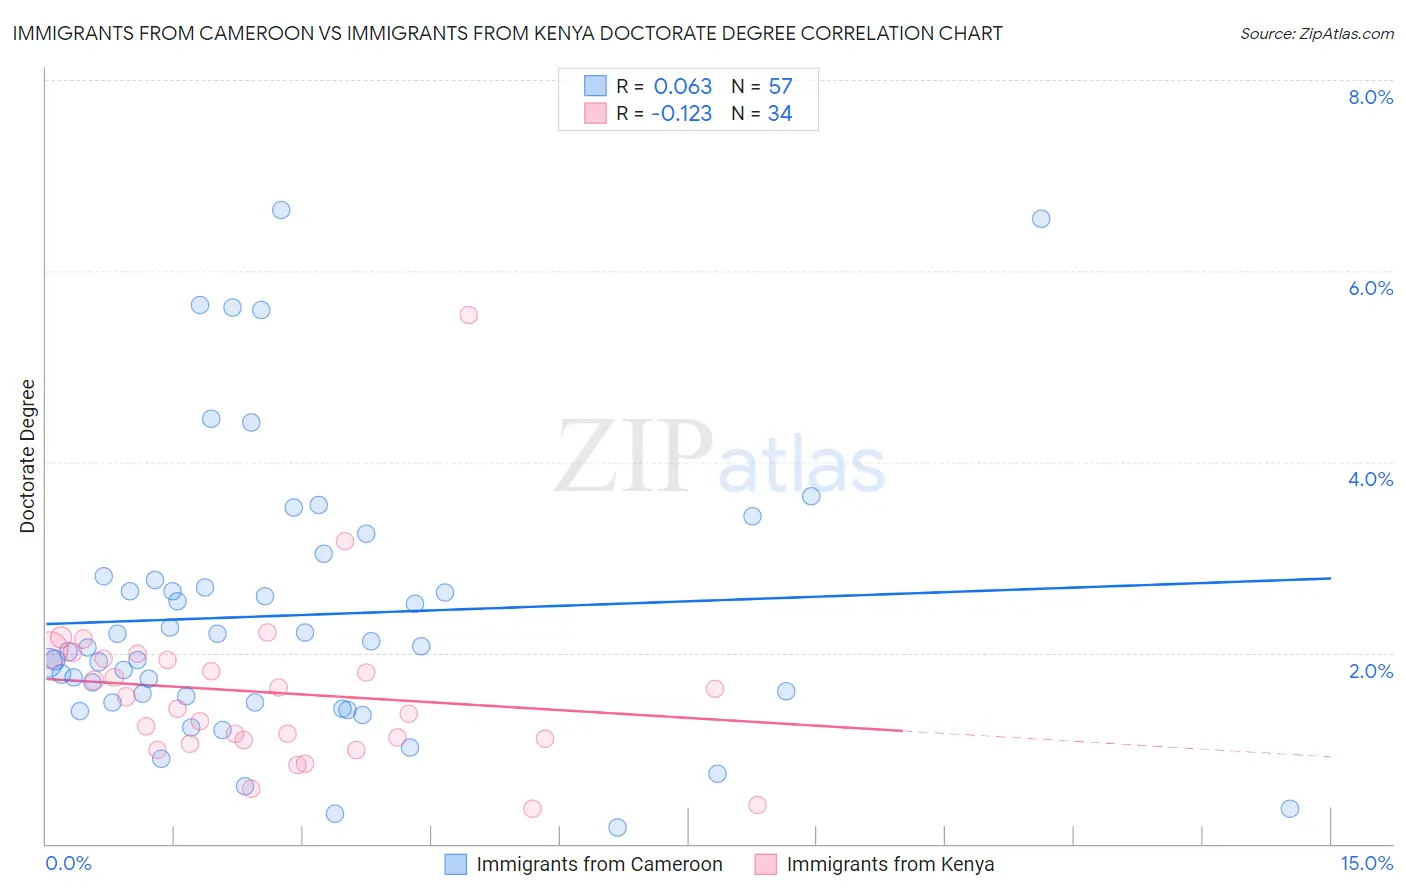
Immigrants from Cameroon vs Immigrants from Kenya Doctorate Degree Correlation Chart
The statistical analysis conducted on geographies consisting of 130,429,472 people shows a slight positive correlation between the proportion of Immigrants from Cameroon and percentage of population with at least doctorate degree education in the United States with a correlation coefficient (R) of 0.063 and weighted average of 2.0%. Similarly, the statistical analysis conducted on geographies consisting of 217,428,476 people shows a poor negative correlation between the proportion of Immigrants from Kenya and percentage of population with at least doctorate degree education in the United States with a correlation coefficient (R) of -0.123 and weighted average of 1.9%, a difference of 3.6%.
Doctorate Degree Correlation Summary
| Measurement | Immigrants from Cameroon | Immigrants from Kenya |
| Minimum | 0.17% | 0.36% |
| Maximum | 6.6% | 5.5% |
| Range | 6.5% | 5.2% |
| Mean | 2.4% | 1.6% |
| Median | 2.1% | 1.5% |
| Interquartile 25% (IQ1) | 1.5% | 1.1% |
| Interquartile 75% (IQ3) | 2.8% | 1.9% |
| Interquartile Range (IQR) | 1.3% | 0.85% |
| Standard Deviation (Sample) | 1.5% | 0.91% |
| Standard Deviation (Population) | 1.4% | 0.90% |
Demographics Similar to Immigrants from Cameroon and Immigrants from Kenya by Doctorate Degree
In terms of doctorate degree, the demographic groups most similar to Immigrants from Cameroon are Serbian (2.0%, a difference of 0.060%), Immigrants from Uzbekistan (2.0%, a difference of 0.15%), Swedish (2.0%, a difference of 0.21%), South American Indian (2.0%, a difference of 0.21%), and Swiss (2.0%, a difference of 0.30%). Similarly, the demographic groups most similar to Immigrants from Kenya are Immigrants from Oceania (1.9%, a difference of 0.050%), Albanian (1.9%, a difference of 0.10%), English (1.9%, a difference of 0.30%), Basque (1.9%, a difference of 0.50%), and Luxembourger (1.9%, a difference of 1.4%).
| Demographics | Rating | Rank | Doctorate Degree |
| Immigrants | Uzbekistan | 89.3 /100 | #133 | Excellent 2.0% |
| Immigrants | Cameroon | 88.9 /100 | #134 | Excellent 2.0% |
| Serbians | 88.7 /100 | #135 | Excellent 2.0% |
| Swedes | 88.3 /100 | #136 | Excellent 2.0% |
| South American Indians | 88.3 /100 | #137 | Excellent 2.0% |
| Swiss | 88.0 /100 | #138 | Excellent 2.0% |
| Afghans | 87.2 /100 | #139 | Excellent 2.0% |
| Immigrants | Africa | 87.0 /100 | #140 | Excellent 2.0% |
| Senegalese | 86.7 /100 | #141 | Excellent 2.0% |
| Italians | 86.0 /100 | #142 | Excellent 2.0% |
| Sierra Leoneans | 85.1 /100 | #143 | Excellent 2.0% |
| Immigrants | Moldova | 84.3 /100 | #144 | Excellent 2.0% |
| Kenyans | 83.6 /100 | #145 | Excellent 1.9% |
| Immigrants | Syria | 83.6 /100 | #146 | Excellent 1.9% |
| Immigrants | Senegal | 82.5 /100 | #147 | Excellent 1.9% |
| Luxembourgers | 81.1 /100 | #148 | Excellent 1.9% |
| Basques | 76.9 /100 | #149 | Good 1.9% |
| English | 75.9 /100 | #150 | Good 1.9% |
| Albanians | 74.8 /100 | #151 | Good 1.9% |
| Immigrants | Kenya | 74.3 /100 | #152 | Good 1.9% |
| Immigrants | Oceania | 74.0 /100 | #153 | Good 1.9% |