Liberian vs Immigrants from Indonesia Master's Degree
COMPARE
Liberian
Immigrants from Indonesia
Master's Degree
Master's Degree Comparison
Liberians
Immigrants from Indonesia
12.8%
MASTER'S DEGREE
1.3/ 100
METRIC RATING
250th/ 347
METRIC RANK
17.6%
MASTER'S DEGREE
99.6/ 100
METRIC RATING
76th/ 347
METRIC RANK
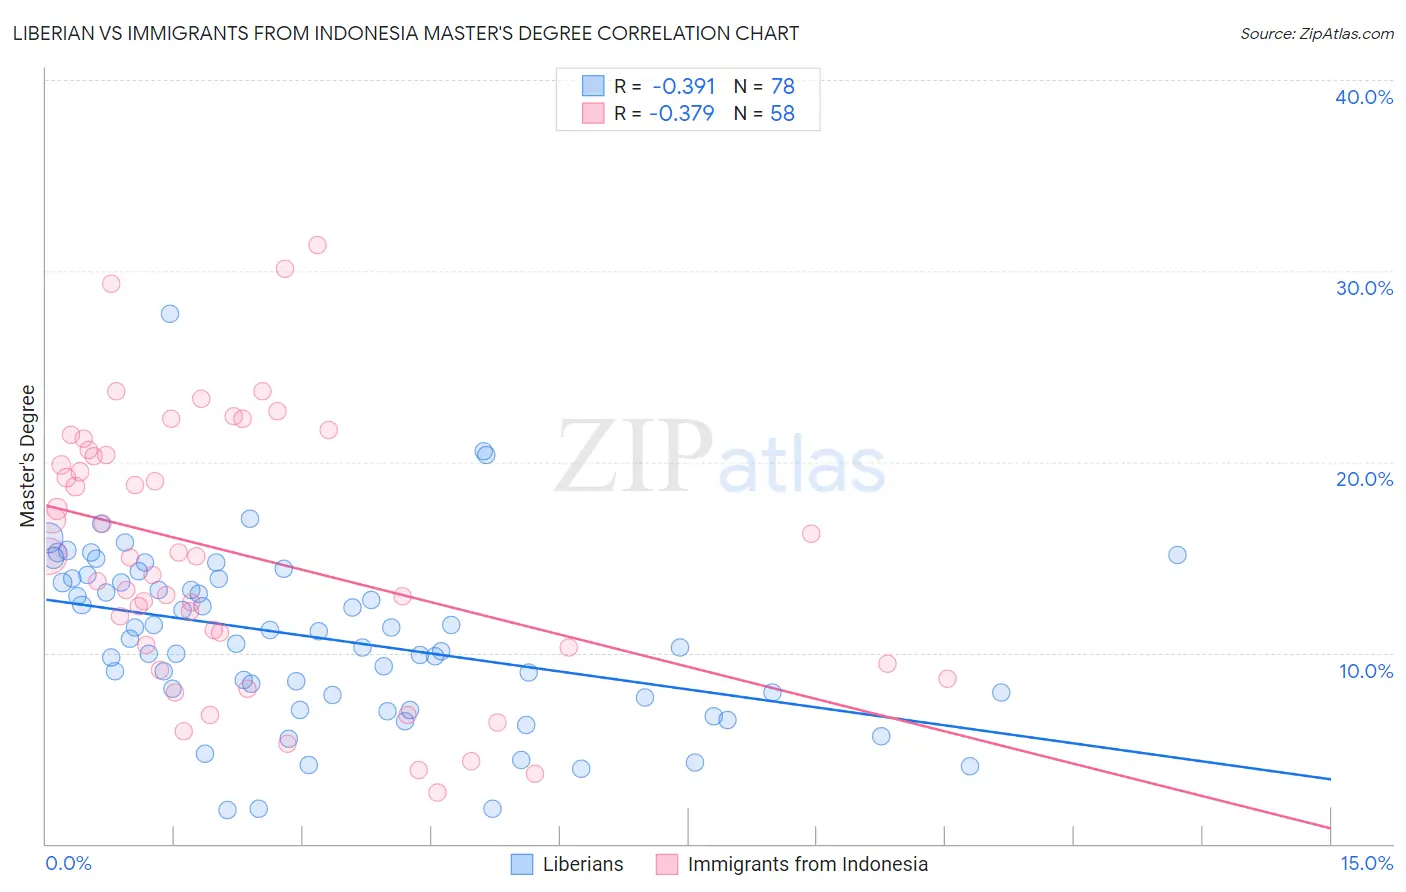
Liberian vs Immigrants from Indonesia Master's Degree Correlation Chart
The statistical analysis conducted on geographies consisting of 118,041,824 people shows a mild negative correlation between the proportion of Liberians and percentage of population with at least master's degree education in the United States with a correlation coefficient (R) of -0.391 and weighted average of 12.8%. Similarly, the statistical analysis conducted on geographies consisting of 215,754,455 people shows a mild negative correlation between the proportion of Immigrants from Indonesia and percentage of population with at least master's degree education in the United States with a correlation coefficient (R) of -0.379 and weighted average of 17.6%, a difference of 37.0%.
Master's Degree Correlation Summary
| Measurement | Liberian | Immigrants from Indonesia |
| Minimum | 1.7% | 2.7% |
| Maximum | 27.8% | 31.4% |
| Range | 26.0% | 28.7% |
| Mean | 10.8% | 15.2% |
| Median | 10.6% | 15.0% |
| Interquartile 25% (IQ1) | 7.8% | 10.3% |
| Interquartile 75% (IQ3) | 13.9% | 20.4% |
| Interquartile Range (IQR) | 6.1% | 10.0% |
| Standard Deviation (Sample) | 4.6% | 6.9% |
| Standard Deviation (Population) | 4.5% | 6.8% |
Similar Demographics by Master's Degree
Demographics Similar to Liberians by Master's Degree
In terms of master's degree, the demographic groups most similar to Liberians are Cree (12.8%, a difference of 0.010%), Tlingit-Haida (12.8%, a difference of 0.030%), African (12.9%, a difference of 0.32%), Iroquois (12.9%, a difference of 0.40%), and Immigrants from Cambodia (12.9%, a difference of 0.44%).
| Demographics | Rating | Rank | Master's Degree |
| Immigrants | Jamaica | 1.9 /100 | #243 | Tragic 13.0% |
| Delaware | 1.7 /100 | #244 | Tragic 13.0% |
| Immigrants | Bahamas | 1.4 /100 | #245 | Tragic 12.9% |
| Immigrants | Cambodia | 1.4 /100 | #246 | Tragic 12.9% |
| Iroquois | 1.4 /100 | #247 | Tragic 12.9% |
| Africans | 1.4 /100 | #248 | Tragic 12.9% |
| Cree | 1.3 /100 | #249 | Tragic 12.8% |
| Liberians | 1.3 /100 | #250 | Tragic 12.8% |
| Tlingit-Haida | 1.3 /100 | #251 | Tragic 12.8% |
| French American Indians | 1.0 /100 | #252 | Tragic 12.7% |
| Immigrants | Dominica | 0.8 /100 | #253 | Tragic 12.6% |
| Indonesians | 0.8 /100 | #254 | Tragic 12.6% |
| Immigrants | Congo | 0.8 /100 | #255 | Tragic 12.6% |
| Immigrants | Portugal | 0.8 /100 | #256 | Tragic 12.6% |
| Osage | 0.7 /100 | #257 | Tragic 12.6% |
Demographics Similar to Immigrants from Indonesia by Master's Degree
In terms of master's degree, the demographic groups most similar to Immigrants from Indonesia are Egyptian (17.6%, a difference of 0.030%), Immigrants from Eastern Europe (17.6%, a difference of 0.12%), Immigrants from Hungary (17.5%, a difference of 0.31%), Immigrants from Romania (17.7%, a difference of 0.40%), and Immigrants from Lebanon (17.5%, a difference of 0.45%).
| Demographics | Rating | Rank | Master's Degree |
| Immigrants | Uzbekistan | 99.8 /100 | #69 | Exceptional 17.9% |
| Immigrants | Western Europe | 99.8 /100 | #70 | Exceptional 17.8% |
| Immigrants | Pakistan | 99.7 /100 | #71 | Exceptional 17.8% |
| Lithuanians | 99.7 /100 | #72 | Exceptional 17.7% |
| Zimbabweans | 99.7 /100 | #73 | Exceptional 17.7% |
| Immigrants | Romania | 99.7 /100 | #74 | Exceptional 17.7% |
| Egyptians | 99.6 /100 | #75 | Exceptional 17.6% |
| Immigrants | Indonesia | 99.6 /100 | #76 | Exceptional 17.6% |
| Immigrants | Eastern Europe | 99.6 /100 | #77 | Exceptional 17.6% |
| Immigrants | Hungary | 99.6 /100 | #78 | Exceptional 17.5% |
| Immigrants | Lebanon | 99.6 /100 | #79 | Exceptional 17.5% |
| Carpatho Rusyns | 99.6 /100 | #80 | Exceptional 17.5% |
| Immigrants | Western Asia | 99.5 /100 | #81 | Exceptional 17.5% |
| Greeks | 99.5 /100 | #82 | Exceptional 17.5% |
| Immigrants | Zimbabwe | 99.5 /100 | #83 | Exceptional 17.4% |