African vs Immigrants from Panama College, Under 1 year
COMPARE
African
Immigrants from Panama
College, Under 1 year
College, Under 1 year Comparison
Africans
Immigrants from Panama
61.1%
COLLEGE, UNDER 1 YEAR
0.3/ 100
METRIC RATING
261st/ 347
METRIC RANK
63.4%
COLLEGE, UNDER 1 YEAR
5.7/ 100
METRIC RATING
218th/ 347
METRIC RANK
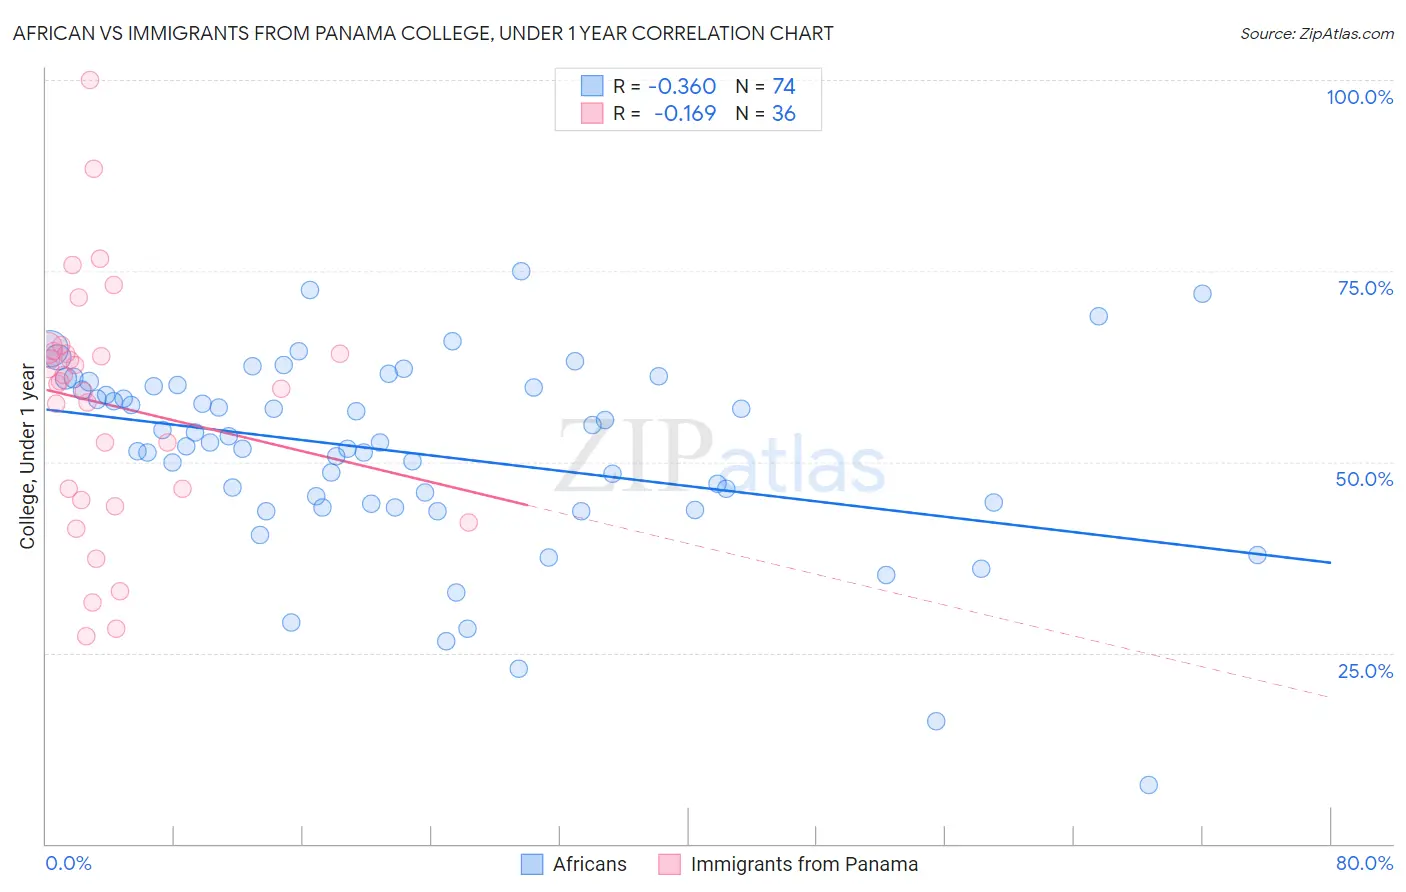
African vs Immigrants from Panama College, Under 1 year Correlation Chart
The statistical analysis conducted on geographies consisting of 470,092,177 people shows a mild negative correlation between the proportion of Africans and percentage of population with at least college, under 1 year education in the United States with a correlation coefficient (R) of -0.360 and weighted average of 61.1%. Similarly, the statistical analysis conducted on geographies consisting of 221,184,524 people shows a poor negative correlation between the proportion of Immigrants from Panama and percentage of population with at least college, under 1 year education in the United States with a correlation coefficient (R) of -0.169 and weighted average of 63.4%, a difference of 3.7%.
College, Under 1 year Correlation Summary
| Measurement | African | Immigrants from Panama |
| Minimum | 7.7% | 27.1% |
| Maximum | 75.0% | 100.0% |
| Range | 67.3% | 72.9% |
| Mean | 51.2% | 57.5% |
| Median | 52.5% | 60.4% |
| Interquartile 25% (IQ1) | 44.5% | 45.7% |
| Interquartile 75% (IQ3) | 59.9% | 64.4% |
| Interquartile Range (IQR) | 15.4% | 18.6% |
| Standard Deviation (Sample) | 12.7% | 16.0% |
| Standard Deviation (Population) | 12.6% | 15.8% |
Similar Demographics by College, Under 1 year
Demographics Similar to Africans by College, Under 1 year
In terms of college, under 1 year, the demographic groups most similar to Africans are Blackfeet (61.1%, a difference of 0.030%), Barbadian (61.1%, a difference of 0.040%), Shoshone (61.1%, a difference of 0.050%), Trinidadian and Tobagonian (61.1%, a difference of 0.11%), and Immigrants from Bahamas (61.1%, a difference of 0.11%).
| Demographics | Rating | Rank | College, Under 1 year |
| Immigrants | Cambodia | 0.4 /100 | #254 | Tragic 61.5% |
| Comanche | 0.4 /100 | #255 | Tragic 61.4% |
| Bangladeshis | 0.4 /100 | #256 | Tragic 61.4% |
| Immigrants | Laos | 0.3 /100 | #257 | Tragic 61.3% |
| Immigrants | Bangladesh | 0.3 /100 | #258 | Tragic 61.3% |
| Indonesians | 0.3 /100 | #259 | Tragic 61.2% |
| Blackfeet | 0.3 /100 | #260 | Tragic 61.1% |
| Africans | 0.3 /100 | #261 | Tragic 61.1% |
| Barbadians | 0.2 /100 | #262 | Tragic 61.1% |
| Shoshone | 0.2 /100 | #263 | Tragic 61.1% |
| Trinidadians and Tobagonians | 0.2 /100 | #264 | Tragic 61.1% |
| Immigrants | Bahamas | 0.2 /100 | #265 | Tragic 61.1% |
| Alaskan Athabascans | 0.2 /100 | #266 | Tragic 61.0% |
| Americans | 0.2 /100 | #267 | Tragic 61.0% |
| Immigrants | Trinidad and Tobago | 0.1 /100 | #268 | Tragic 60.7% |
Demographics Similar to Immigrants from Panama by College, Under 1 year
In terms of college, under 1 year, the demographic groups most similar to Immigrants from Panama are Immigrants from Fiji (63.4%, a difference of 0.010%), Immigrants from Uruguay (63.4%, a difference of 0.020%), Portuguese (63.4%, a difference of 0.030%), Cree (63.3%, a difference of 0.11%), and Immigrants from Senegal (63.3%, a difference of 0.16%).
| Demographics | Rating | Rank | College, Under 1 year |
| Native Hawaiians | 10.6 /100 | #211 | Poor 63.9% |
| Immigrants | Middle Africa | 10.5 /100 | #212 | Poor 63.9% |
| Immigrants | South America | 9.1 /100 | #213 | Tragic 63.8% |
| Immigrants | Nigeria | 8.8 /100 | #214 | Tragic 63.7% |
| Senegalese | 7.7 /100 | #215 | Tragic 63.6% |
| Hmong | 6.8 /100 | #216 | Tragic 63.5% |
| Immigrants | Uruguay | 5.8 /100 | #217 | Tragic 63.4% |
| Immigrants | Panama | 5.7 /100 | #218 | Tragic 63.4% |
| Immigrants | Fiji | 5.7 /100 | #219 | Tragic 63.4% |
| Portuguese | 5.6 /100 | #220 | Tragic 63.4% |
| Cree | 5.2 /100 | #221 | Tragic 63.3% |
| Immigrants | Senegal | 5.0 /100 | #222 | Tragic 63.3% |
| Immigrants | Costa Rica | 4.5 /100 | #223 | Tragic 63.2% |
| Sub-Saharan Africans | 4.4 /100 | #224 | Tragic 63.2% |
| Immigrants | Peru | 4.0 /100 | #225 | Tragic 63.1% |