African vs Ukrainian 9th Grade
COMPARE
African
Ukrainian
9th Grade
9th Grade Comparison
Africans
Ukrainians
94.5%
9TH GRADE
9.0/ 100
METRIC RATING
219th/ 347
METRIC RANK
95.9%
9TH GRADE
99.7/ 100
METRIC RATING
62nd/ 347
METRIC RANK
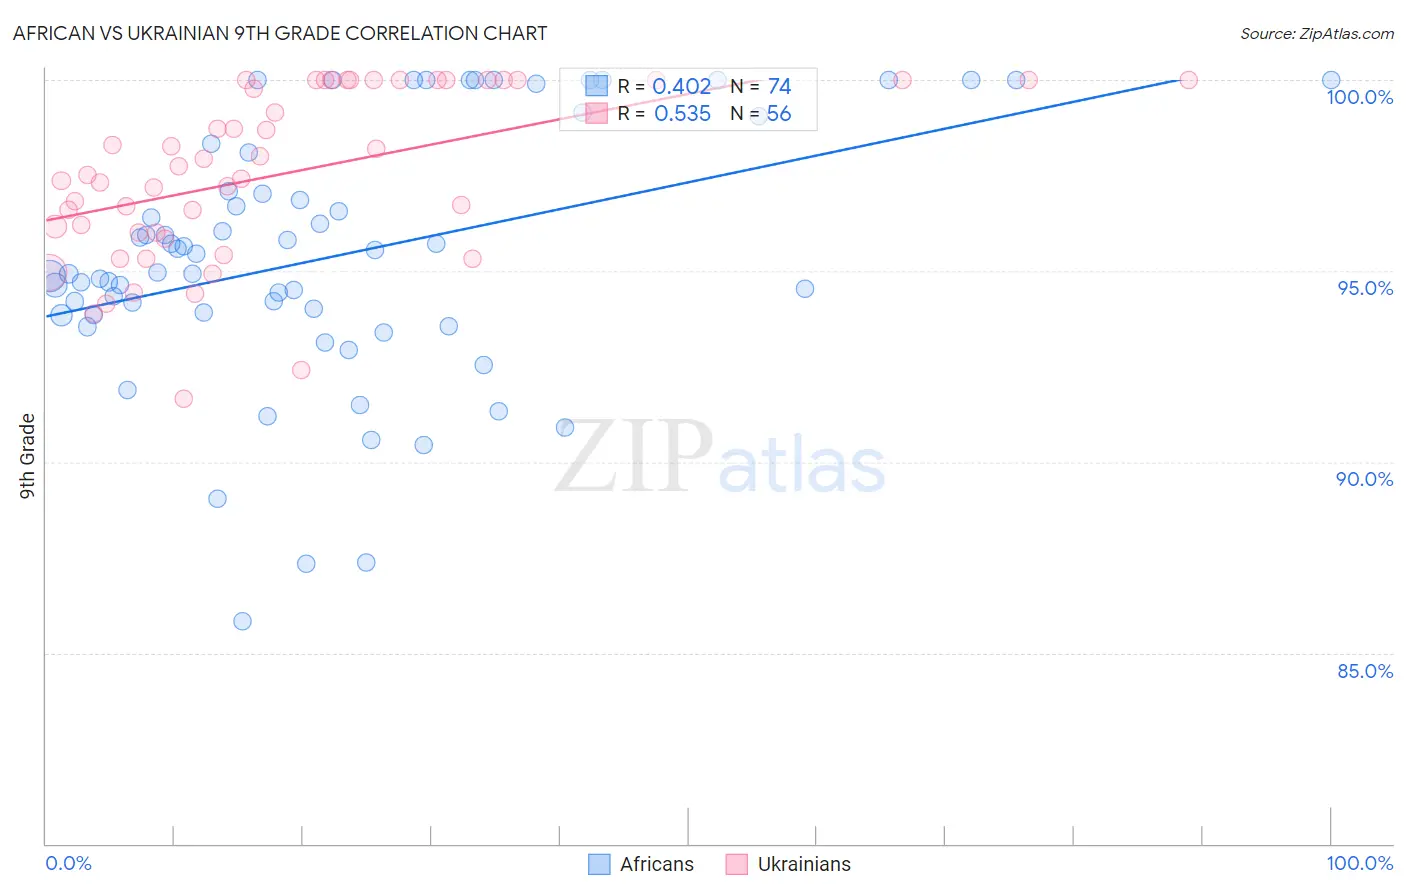
African vs Ukrainian 9th Grade Correlation Chart
The statistical analysis conducted on geographies consisting of 470,094,658 people shows a moderate positive correlation between the proportion of Africans and percentage of population with at least 9th grade education in the United States with a correlation coefficient (R) of 0.402 and weighted average of 94.5%. Similarly, the statistical analysis conducted on geographies consisting of 448,696,826 people shows a substantial positive correlation between the proportion of Ukrainians and percentage of population with at least 9th grade education in the United States with a correlation coefficient (R) of 0.535 and weighted average of 95.9%, a difference of 1.5%.
9th Grade Correlation Summary
| Measurement | African | Ukrainian |
| Minimum | 85.8% | 91.6% |
| Maximum | 100.0% | 100.0% |
| Range | 14.2% | 8.4% |
| Mean | 95.4% | 97.6% |
| Median | 95.2% | 97.6% |
| Interquartile 25% (IQ1) | 93.9% | 96.0% |
| Interquartile 75% (IQ3) | 98.1% | 100.0% |
| Interquartile Range (IQR) | 4.2% | 4.0% |
| Standard Deviation (Sample) | 3.3% | 2.2% |
| Standard Deviation (Population) | 3.3% | 2.2% |
Similar Demographics by 9th Grade
Demographics Similar to Africans by 9th Grade
In terms of 9th grade, the demographic groups most similar to Africans are Portuguese (94.5%, a difference of 0.0%), Indian (Asian) (94.5%, a difference of 0.010%), Asian (94.5%, a difference of 0.020%), Immigrants from Eastern Africa (94.5%, a difference of 0.020%), and Immigrants from Asia (94.4%, a difference of 0.030%).
| Demographics | Rating | Rank | 9th Grade |
| Immigrants | Malaysia | 12.2 /100 | #212 | Poor 94.5% |
| Immigrants | Oceania | 12.1 /100 | #213 | Poor 94.5% |
| Immigrants | Liberia | 11.8 /100 | #214 | Poor 94.5% |
| Immigrants | Syria | 11.0 /100 | #215 | Poor 94.5% |
| Immigrants | Western Asia | 10.7 /100 | #216 | Poor 94.5% |
| Asians | 9.9 /100 | #217 | Tragic 94.5% |
| Portuguese | 9.2 /100 | #218 | Tragic 94.5% |
| Africans | 9.0 /100 | #219 | Tragic 94.5% |
| Indians (Asian) | 8.6 /100 | #220 | Tragic 94.5% |
| Immigrants | Eastern Africa | 8.2 /100 | #221 | Tragic 94.5% |
| Immigrants | Asia | 7.7 /100 | #222 | Tragic 94.4% |
| Bahamians | 7.0 /100 | #223 | Tragic 94.4% |
| Tongans | 6.0 /100 | #224 | Tragic 94.4% |
| Ethiopians | 5.4 /100 | #225 | Tragic 94.4% |
| Sub-Saharan Africans | 5.4 /100 | #226 | Tragic 94.4% |
Demographics Similar to Ukrainians by 9th Grade
In terms of 9th grade, the demographic groups most similar to Ukrainians are Sioux (95.9%, a difference of 0.010%), Native Hawaiian (95.9%, a difference of 0.020%), New Zealander (95.9%, a difference of 0.040%), Canadian (95.9%, a difference of 0.040%), and Macedonian (96.0%, a difference of 0.050%).
| Demographics | Rating | Rank | 9th Grade |
| Immigrants | Austria | 99.8 /100 | #55 | Exceptional 96.0% |
| Immigrants | North America | 99.8 /100 | #56 | Exceptional 96.0% |
| Macedonians | 99.8 /100 | #57 | Exceptional 96.0% |
| Aleuts | 99.8 /100 | #58 | Exceptional 96.0% |
| New Zealanders | 99.8 /100 | #59 | Exceptional 95.9% |
| Native Hawaiians | 99.8 /100 | #60 | Exceptional 95.9% |
| Sioux | 99.8 /100 | #61 | Exceptional 95.9% |
| Ukrainians | 99.7 /100 | #62 | Exceptional 95.9% |
| Canadians | 99.7 /100 | #63 | Exceptional 95.9% |
| Zimbabweans | 99.7 /100 | #64 | Exceptional 95.9% |
| Immigrants | England | 99.6 /100 | #65 | Exceptional 95.9% |
| Immigrants | Netherlands | 99.6 /100 | #66 | Exceptional 95.8% |
| Cypriots | 99.6 /100 | #67 | Exceptional 95.8% |
| Immigrants | Ireland | 99.6 /100 | #68 | Exceptional 95.8% |
| Immigrants | Lithuania | 99.6 /100 | #69 | Exceptional 95.8% |