African vs Immigrants from Caribbean 8th Grade
COMPARE
African
Immigrants from Caribbean
8th Grade
8th Grade Comparison
Africans
Immigrants from Caribbean
95.4%
8TH GRADE
13.6/ 100
METRIC RATING
210th/ 347
METRIC RANK
93.5%
8TH GRADE
0.0/ 100
METRIC RATING
313th/ 347
METRIC RANK
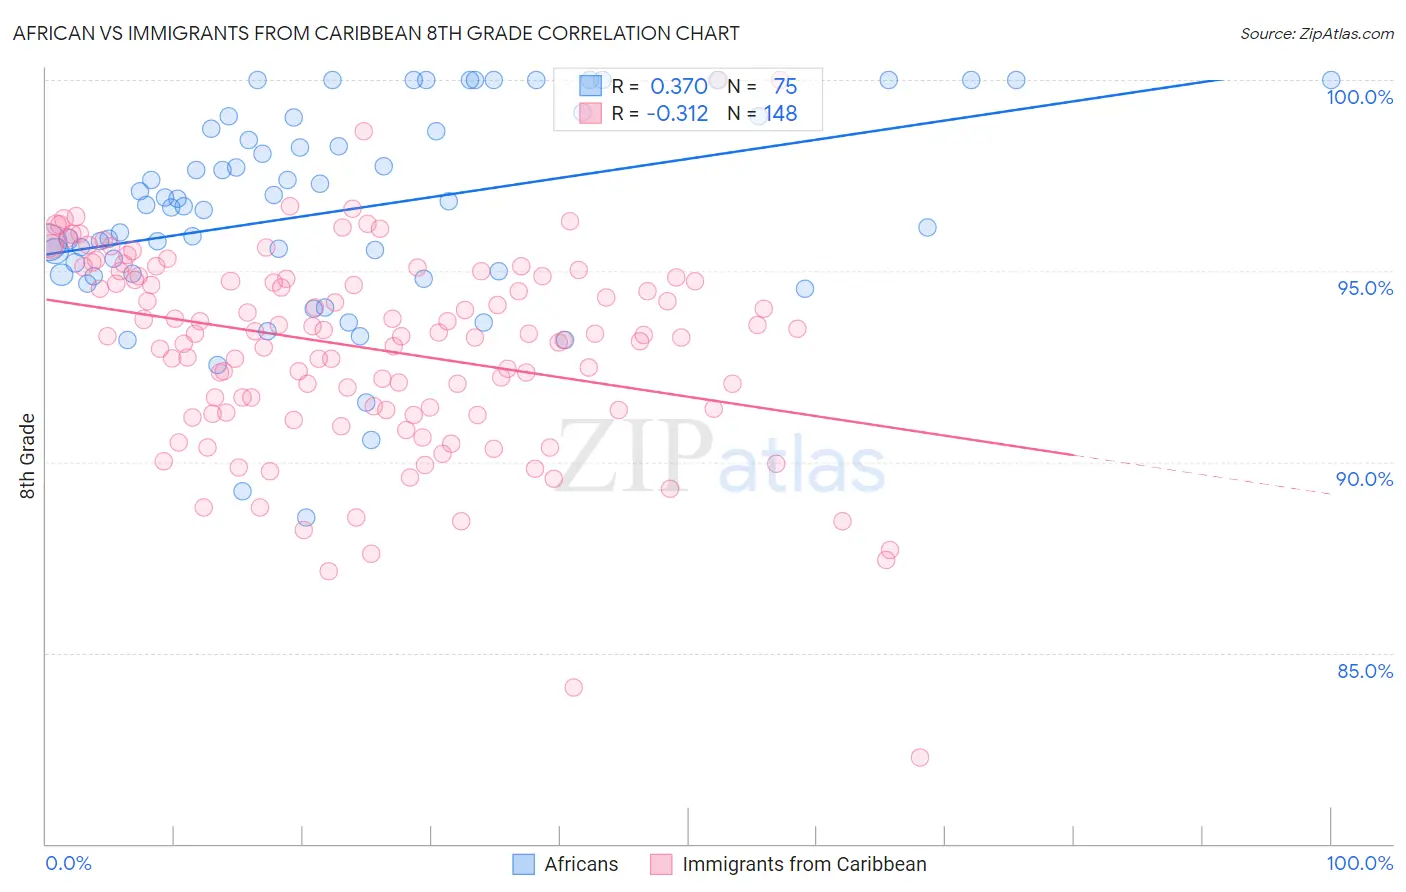
African vs Immigrants from Caribbean 8th Grade Correlation Chart
The statistical analysis conducted on geographies consisting of 470,094,744 people shows a mild positive correlation between the proportion of Africans and percentage of population with at least 8th grade education in the United States with a correlation coefficient (R) of 0.370 and weighted average of 95.4%. Similarly, the statistical analysis conducted on geographies consisting of 450,064,731 people shows a mild negative correlation between the proportion of Immigrants from Caribbean and percentage of population with at least 8th grade education in the United States with a correlation coefficient (R) of -0.312 and weighted average of 93.5%, a difference of 2.1%.
8th Grade Correlation Summary
| Measurement | African | Immigrants from Caribbean |
| Minimum | 88.6% | 82.3% |
| Maximum | 100.0% | 100.0% |
| Range | 11.4% | 17.7% |
| Mean | 96.6% | 93.0% |
| Median | 96.7% | 93.3% |
| Interquartile 25% (IQ1) | 94.9% | 91.4% |
| Interquartile 75% (IQ3) | 99.0% | 94.8% |
| Interquartile Range (IQR) | 4.1% | 3.5% |
| Standard Deviation (Sample) | 2.7% | 2.7% |
| Standard Deviation (Population) | 2.7% | 2.7% |
Similar Demographics by 8th Grade
Demographics Similar to Africans by 8th Grade
In terms of 8th grade, the demographic groups most similar to Africans are Immigrants from Lebanon (95.4%, a difference of 0.0%), Portuguese (95.5%, a difference of 0.010%), Immigrants from Sudan (95.5%, a difference of 0.020%), Immigrants from Morocco (95.4%, a difference of 0.020%), and Hawaiian (95.5%, a difference of 0.040%).
| Demographics | Rating | Rank | 8th Grade |
| Moroccans | 17.4 /100 | #203 | Poor 95.5% |
| Hawaiians | 16.7 /100 | #204 | Poor 95.5% |
| Immigrants | Bahamas | 16.7 /100 | #205 | Poor 95.5% |
| Comanche | 16.3 /100 | #206 | Poor 95.5% |
| Immigrants | Sudan | 15.1 /100 | #207 | Poor 95.5% |
| Portuguese | 14.3 /100 | #208 | Poor 95.5% |
| Immigrants | Lebanon | 13.7 /100 | #209 | Poor 95.4% |
| Africans | 13.6 /100 | #210 | Poor 95.4% |
| Immigrants | Morocco | 12.4 /100 | #211 | Poor 95.4% |
| Immigrants | Pakistan | 9.7 /100 | #212 | Tragic 95.4% |
| Laotians | 9.0 /100 | #213 | Tragic 95.4% |
| Immigrants | Chile | 9.0 /100 | #214 | Tragic 95.4% |
| Immigrants | Liberia | 8.9 /100 | #215 | Tragic 95.4% |
| Samoans | 8.4 /100 | #216 | Tragic 95.4% |
| Immigrants | Eastern Asia | 8.3 /100 | #217 | Tragic 95.4% |
Demographics Similar to Immigrants from Caribbean by 8th Grade
In terms of 8th grade, the demographic groups most similar to Immigrants from Caribbean are Immigrants from Vietnam (93.5%, a difference of 0.010%), Vietnamese (93.5%, a difference of 0.020%), Cape Verdean (93.5%, a difference of 0.030%), Immigrants (93.6%, a difference of 0.070%), and Japanese (93.6%, a difference of 0.070%).
| Demographics | Rating | Rank | 8th Grade |
| Immigrants | Guyana | 0.0 /100 | #306 | Tragic 93.8% |
| Immigrants | Portugal | 0.0 /100 | #307 | Tragic 93.8% |
| Ecuadorians | 0.0 /100 | #308 | Tragic 93.6% |
| Immigrants | Immigrants | 0.0 /100 | #309 | Tragic 93.6% |
| Japanese | 0.0 /100 | #310 | Tragic 93.6% |
| Immigrants | Bangladesh | 0.0 /100 | #311 | Tragic 93.6% |
| Cape Verdeans | 0.0 /100 | #312 | Tragic 93.5% |
| Immigrants | Caribbean | 0.0 /100 | #313 | Tragic 93.5% |
| Immigrants | Vietnam | 0.0 /100 | #314 | Tragic 93.5% |
| Vietnamese | 0.0 /100 | #315 | Tragic 93.5% |
| Immigrants | Cambodia | 0.0 /100 | #316 | Tragic 93.3% |
| Immigrants | Ecuador | 0.0 /100 | #317 | Tragic 93.3% |
| Puerto Ricans | 0.0 /100 | #318 | Tragic 93.2% |
| Immigrants | Cuba | 0.0 /100 | #319 | Tragic 93.2% |
| Immigrants | Fiji | 0.0 /100 | #320 | Tragic 93.2% |