Seminole vs Immigrants from Senegal 8th Grade
COMPARE
Seminole
Immigrants from Senegal
8th Grade
8th Grade Comparison
Seminole
Immigrants from Senegal
95.8%
8TH GRADE
67.7/ 100
METRIC RATING
160th/ 347
METRIC RANK
95.1%
8TH GRADE
1.4/ 100
METRIC RATING
247th/ 347
METRIC RANK
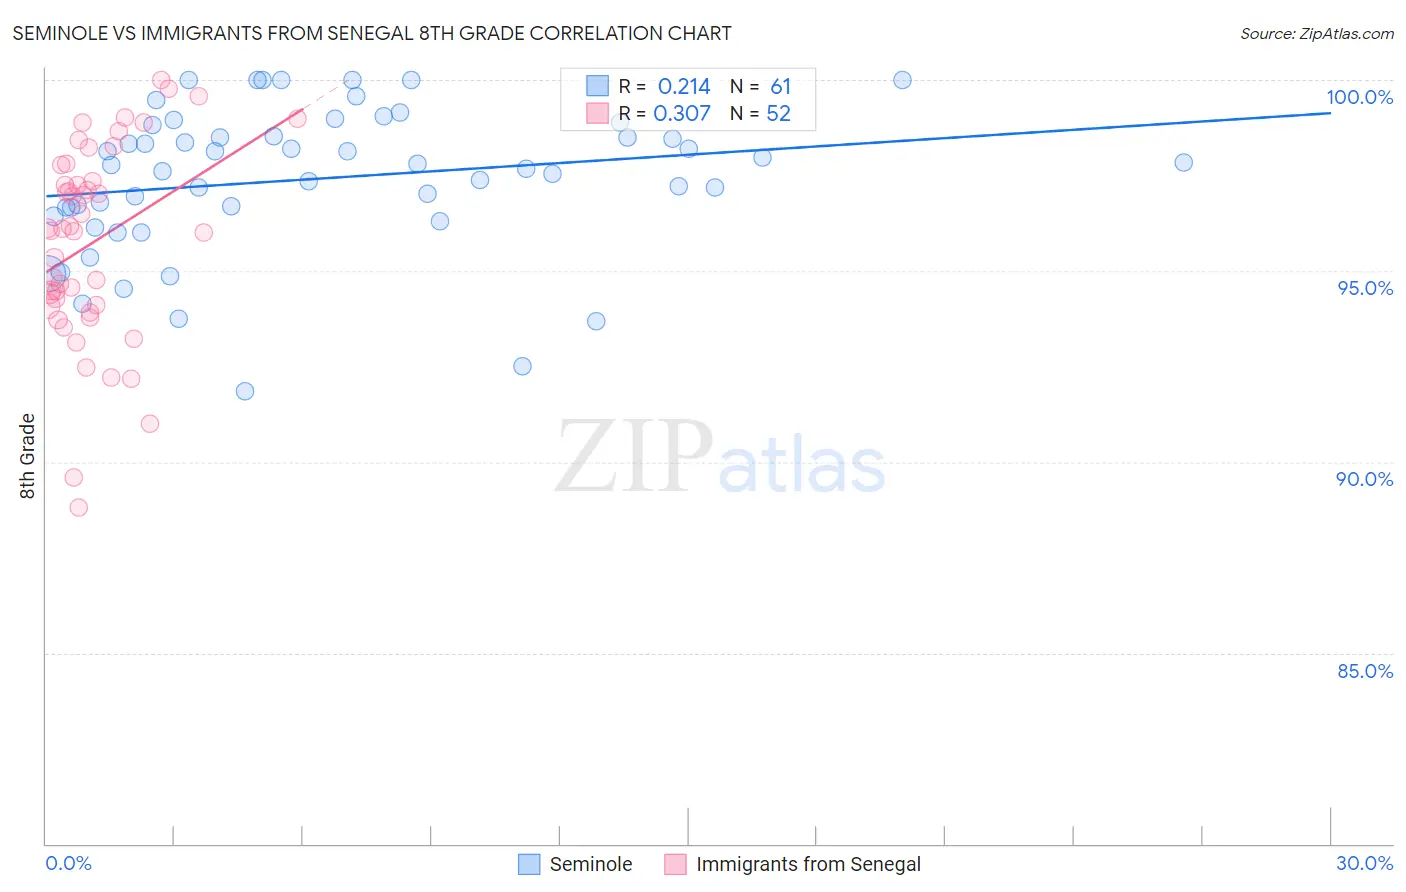
Seminole vs Immigrants from Senegal 8th Grade Correlation Chart
The statistical analysis conducted on geographies consisting of 118,314,216 people shows a weak positive correlation between the proportion of Seminole and percentage of population with at least 8th grade education in the United States with a correlation coefficient (R) of 0.214 and weighted average of 95.8%. Similarly, the statistical analysis conducted on geographies consisting of 90,130,297 people shows a mild positive correlation between the proportion of Immigrants from Senegal and percentage of population with at least 8th grade education in the United States with a correlation coefficient (R) of 0.307 and weighted average of 95.1%, a difference of 0.82%.
8th Grade Correlation Summary
| Measurement | Seminole | Immigrants from Senegal |
| Minimum | 91.9% | 88.8% |
| Maximum | 100.0% | 100.0% |
| Range | 8.1% | 11.2% |
| Mean | 97.4% | 95.7% |
| Median | 97.8% | 96.1% |
| Interquartile 25% (IQ1) | 96.6% | 94.1% |
| Interquartile 75% (IQ3) | 98.7% | 97.6% |
| Interquartile Range (IQR) | 2.1% | 3.5% |
| Standard Deviation (Sample) | 1.9% | 2.6% |
| Standard Deviation (Population) | 1.9% | 2.5% |
Similar Demographics by 8th Grade
Demographics Similar to Seminole by 8th Grade
In terms of 8th grade, the demographic groups most similar to Seminole are Bermudan (95.8%, a difference of 0.0%), Immigrants from Kenya (95.8%, a difference of 0.0%), Arab (95.9%, a difference of 0.010%), Immigrants from Kazakhstan (95.9%, a difference of 0.010%), and Immigrants from Taiwan (95.9%, a difference of 0.020%).
| Demographics | Rating | Rank | 8th Grade |
| Immigrants | Jordan | 79.5 /100 | #153 | Good 95.9% |
| Hopi | 79.4 /100 | #154 | Good 95.9% |
| Kenyans | 74.5 /100 | #155 | Good 95.9% |
| Ugandans | 74.1 /100 | #156 | Good 95.9% |
| Immigrants | Taiwan | 70.5 /100 | #157 | Good 95.9% |
| Arabs | 69.4 /100 | #158 | Good 95.9% |
| Immigrants | Kazakhstan | 68.4 /100 | #159 | Good 95.9% |
| Seminole | 67.7 /100 | #160 | Good 95.8% |
| Bermudans | 67.5 /100 | #161 | Good 95.8% |
| Immigrants | Kenya | 67.2 /100 | #162 | Good 95.8% |
| Immigrants | Sri Lanka | 64.1 /100 | #163 | Good 95.8% |
| Immigrants | Italy | 63.5 /100 | #164 | Good 95.8% |
| Alsatians | 61.4 /100 | #165 | Good 95.8% |
| Immigrants | Poland | 61.1 /100 | #166 | Good 95.8% |
| Spaniards | 60.0 /100 | #167 | Good 95.8% |
Demographics Similar to Immigrants from Senegal by 8th Grade
In terms of 8th grade, the demographic groups most similar to Immigrants from Senegal are Somali (95.1%, a difference of 0.0%), Jamaican (95.1%, a difference of 0.010%), Uruguayan (95.1%, a difference of 0.010%), Tongan (95.1%, a difference of 0.040%), and Paiute (95.1%, a difference of 0.040%).
| Demographics | Rating | Rank | 8th Grade |
| Ethiopians | 2.0 /100 | #240 | Tragic 95.1% |
| South American Indians | 1.9 /100 | #241 | Tragic 95.1% |
| Tongans | 1.7 /100 | #242 | Tragic 95.1% |
| Paiute | 1.7 /100 | #243 | Tragic 95.1% |
| Immigrants | Middle Africa | 1.7 /100 | #244 | Tragic 95.1% |
| Jamaicans | 1.4 /100 | #245 | Tragic 95.1% |
| Somalis | 1.4 /100 | #246 | Tragic 95.1% |
| Immigrants | Senegal | 1.4 /100 | #247 | Tragic 95.1% |
| Uruguayans | 1.2 /100 | #248 | Tragic 95.1% |
| Immigrants | China | 1.1 /100 | #249 | Tragic 95.0% |
| Koreans | 1.1 /100 | #250 | Tragic 95.0% |
| Bolivians | 1.0 /100 | #251 | Tragic 95.0% |
| Immigrants | Ethiopia | 1.0 /100 | #252 | Tragic 95.0% |
| U.S. Virgin Islanders | 0.9 /100 | #253 | Tragic 95.0% |
| Immigrants | Cameroon | 0.8 /100 | #254 | Tragic 95.0% |