Croatian vs Immigrants from Senegal 8th Grade
COMPARE
Croatian
Immigrants from Senegal
8th Grade
8th Grade Comparison
Croatians
Immigrants from Senegal
97.2%
8TH GRADE
100.0/ 100
METRIC RATING
20th/ 347
METRIC RANK
95.1%
8TH GRADE
1.4/ 100
METRIC RATING
247th/ 347
METRIC RANK
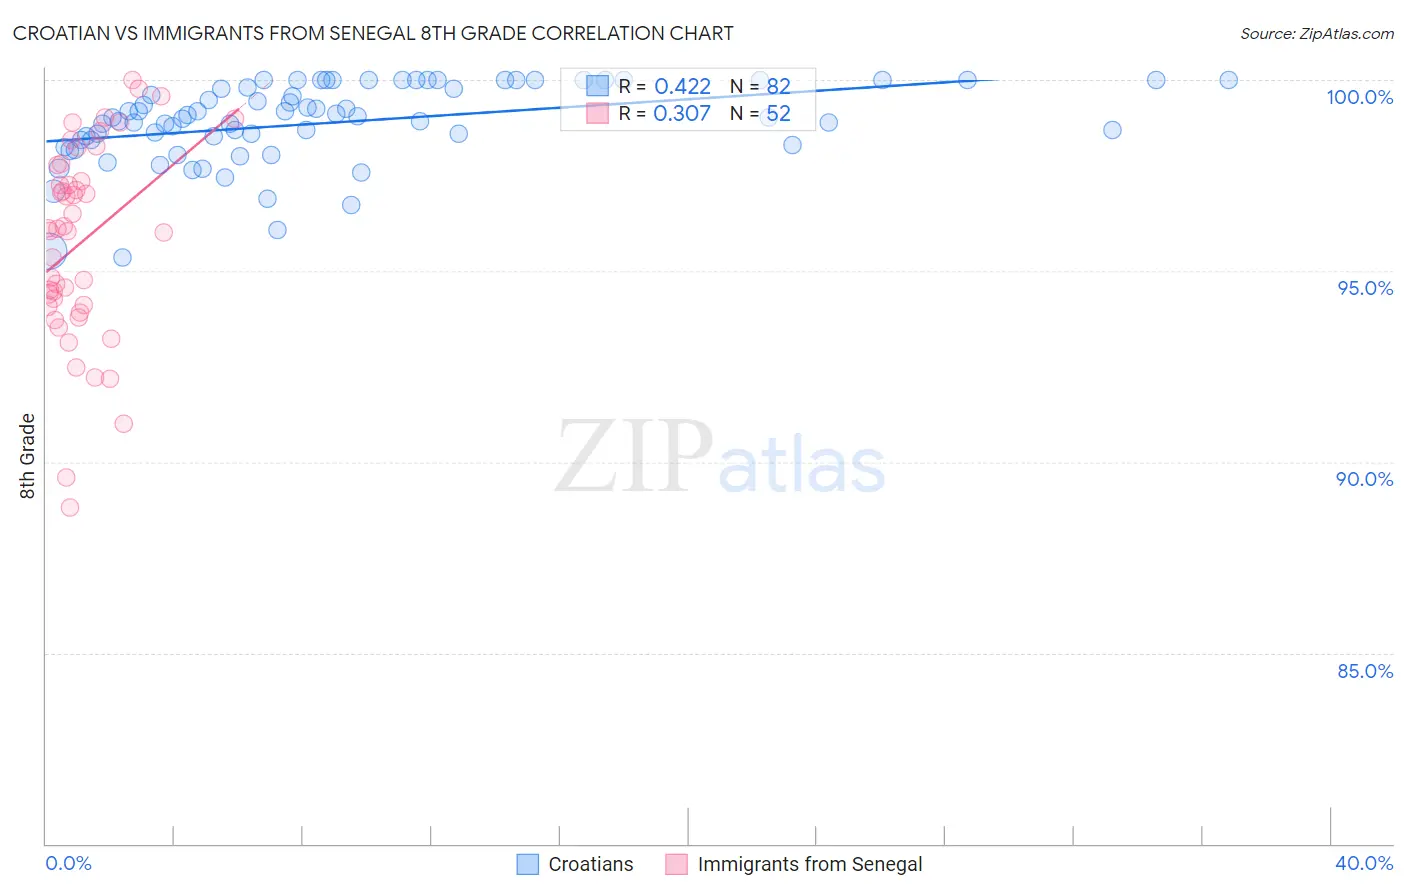
Croatian vs Immigrants from Senegal 8th Grade Correlation Chart
The statistical analysis conducted on geographies consisting of 375,734,226 people shows a moderate positive correlation between the proportion of Croatians and percentage of population with at least 8th grade education in the United States with a correlation coefficient (R) of 0.422 and weighted average of 97.2%. Similarly, the statistical analysis conducted on geographies consisting of 90,130,297 people shows a mild positive correlation between the proportion of Immigrants from Senegal and percentage of population with at least 8th grade education in the United States with a correlation coefficient (R) of 0.307 and weighted average of 95.1%, a difference of 2.3%.
8th Grade Correlation Summary
| Measurement | Croatian | Immigrants from Senegal |
| Minimum | 95.4% | 88.8% |
| Maximum | 100.0% | 100.0% |
| Range | 4.6% | 11.2% |
| Mean | 98.9% | 95.7% |
| Median | 99.0% | 96.1% |
| Interquartile 25% (IQ1) | 98.4% | 94.1% |
| Interquartile 75% (IQ3) | 100.0% | 97.6% |
| Interquartile Range (IQR) | 1.6% | 3.5% |
| Standard Deviation (Sample) | 1.1% | 2.6% |
| Standard Deviation (Population) | 1.1% | 2.5% |
Similar Demographics by 8th Grade
Demographics Similar to Croatians by 8th Grade
In terms of 8th grade, the demographic groups most similar to Croatians are Danish (97.2%, a difference of 0.020%), Welsh (97.2%, a difference of 0.050%), Scottish (97.3%, a difference of 0.060%), French Canadian (97.2%, a difference of 0.060%), and Scandinavian (97.2%, a difference of 0.060%).
| Demographics | Rating | Rank | 8th Grade |
| Alaskan Athabascans | 100.0 /100 | #13 | Exceptional 97.3% |
| English | 100.0 /100 | #14 | Exceptional 97.3% |
| Pennsylvania Germans | 100.0 /100 | #15 | Exceptional 97.3% |
| Tlingit-Haida | 100.0 /100 | #16 | Exceptional 97.3% |
| Irish | 100.0 /100 | #17 | Exceptional 97.3% |
| Lithuanians | 100.0 /100 | #18 | Exceptional 97.3% |
| Scottish | 100.0 /100 | #19 | Exceptional 97.3% |
| Croatians | 100.0 /100 | #20 | Exceptional 97.2% |
| Danes | 100.0 /100 | #21 | Exceptional 97.2% |
| Welsh | 100.0 /100 | #22 | Exceptional 97.2% |
| French Canadians | 100.0 /100 | #23 | Exceptional 97.2% |
| Scandinavians | 100.0 /100 | #24 | Exceptional 97.2% |
| Czechs | 100.0 /100 | #25 | Exceptional 97.1% |
| French | 100.0 /100 | #26 | Exceptional 97.1% |
| Scotch-Irish | 100.0 /100 | #27 | Exceptional 97.1% |
Demographics Similar to Immigrants from Senegal by 8th Grade
In terms of 8th grade, the demographic groups most similar to Immigrants from Senegal are Somali (95.1%, a difference of 0.0%), Jamaican (95.1%, a difference of 0.010%), Uruguayan (95.1%, a difference of 0.010%), Tongan (95.1%, a difference of 0.040%), and Paiute (95.1%, a difference of 0.040%).
| Demographics | Rating | Rank | 8th Grade |
| Ethiopians | 2.0 /100 | #240 | Tragic 95.1% |
| South American Indians | 1.9 /100 | #241 | Tragic 95.1% |
| Tongans | 1.7 /100 | #242 | Tragic 95.1% |
| Paiute | 1.7 /100 | #243 | Tragic 95.1% |
| Immigrants | Middle Africa | 1.7 /100 | #244 | Tragic 95.1% |
| Jamaicans | 1.4 /100 | #245 | Tragic 95.1% |
| Somalis | 1.4 /100 | #246 | Tragic 95.1% |
| Immigrants | Senegal | 1.4 /100 | #247 | Tragic 95.1% |
| Uruguayans | 1.2 /100 | #248 | Tragic 95.1% |
| Immigrants | China | 1.1 /100 | #249 | Tragic 95.0% |
| Koreans | 1.1 /100 | #250 | Tragic 95.0% |
| Bolivians | 1.0 /100 | #251 | Tragic 95.0% |
| Immigrants | Ethiopia | 1.0 /100 | #252 | Tragic 95.0% |
| U.S. Virgin Islanders | 0.9 /100 | #253 | Tragic 95.0% |
| Immigrants | Cameroon | 0.8 /100 | #254 | Tragic 95.0% |