African vs Immigrants from Colombia 8th Grade
COMPARE
African
Immigrants from Colombia
8th Grade
8th Grade Comparison
Africans
Immigrants from Colombia
95.4%
8TH GRADE
13.6/ 100
METRIC RATING
210th/ 347
METRIC RANK
94.7%
8TH GRADE
0.2/ 100
METRIC RATING
275th/ 347
METRIC RANK
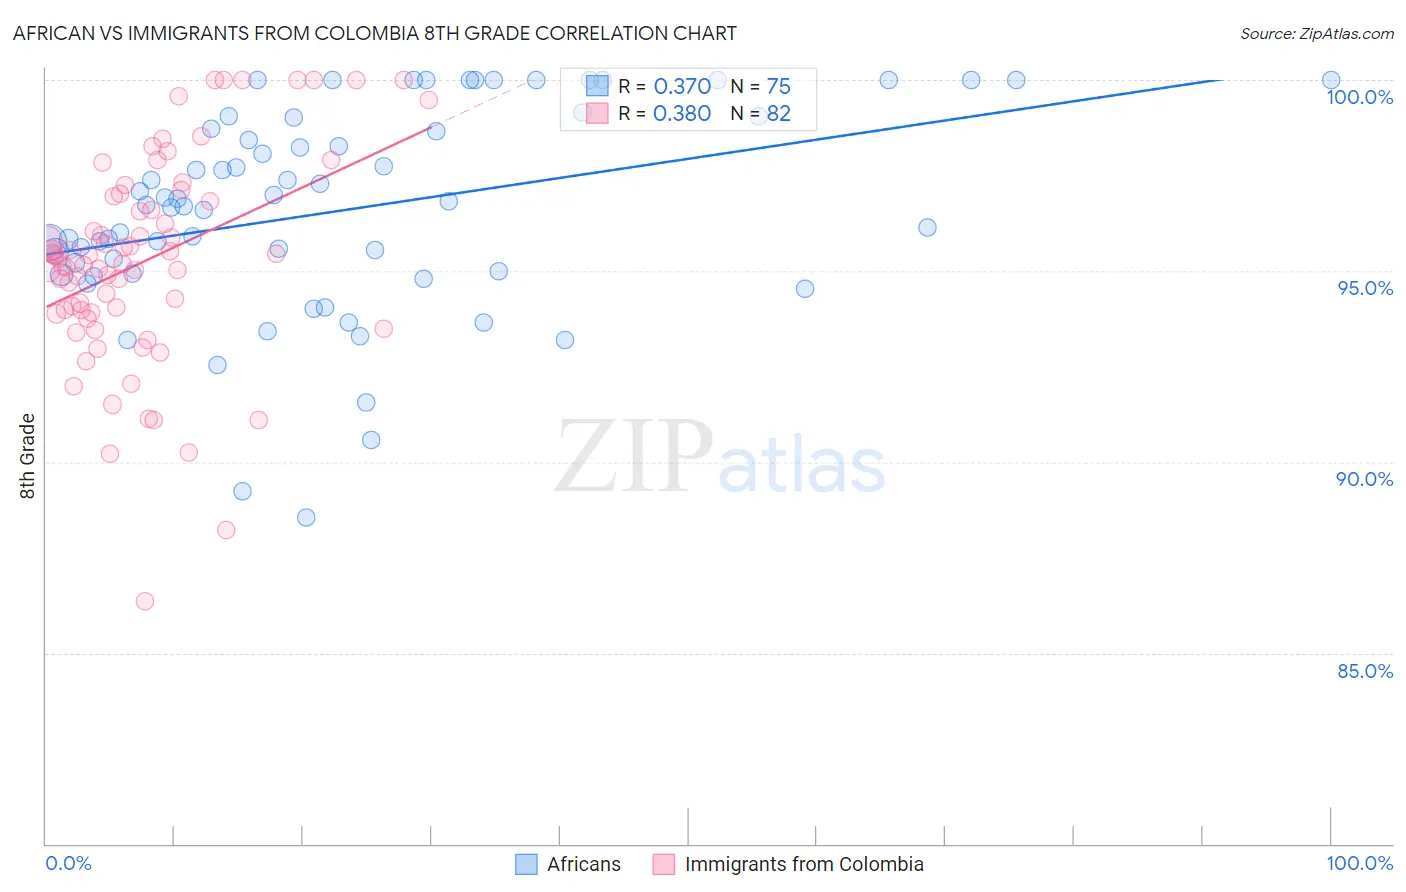
African vs Immigrants from Colombia 8th Grade Correlation Chart
The statistical analysis conducted on geographies consisting of 470,094,744 people shows a mild positive correlation between the proportion of Africans and percentage of population with at least 8th grade education in the United States with a correlation coefficient (R) of 0.370 and weighted average of 95.4%. Similarly, the statistical analysis conducted on geographies consisting of 378,598,469 people shows a mild positive correlation between the proportion of Immigrants from Colombia and percentage of population with at least 8th grade education in the United States with a correlation coefficient (R) of 0.380 and weighted average of 94.7%, a difference of 0.75%.
8th Grade Correlation Summary
| Measurement | African | Immigrants from Colombia |
| Minimum | 88.6% | 86.4% |
| Maximum | 100.0% | 100.0% |
| Range | 11.4% | 13.6% |
| Mean | 96.6% | 95.3% |
| Median | 96.7% | 95.3% |
| Interquartile 25% (IQ1) | 94.9% | 93.9% |
| Interquartile 75% (IQ3) | 99.0% | 96.9% |
| Interquartile Range (IQR) | 4.1% | 3.0% |
| Standard Deviation (Sample) | 2.7% | 2.7% |
| Standard Deviation (Population) | 2.7% | 2.7% |
Similar Demographics by 8th Grade
Demographics Similar to Africans by 8th Grade
In terms of 8th grade, the demographic groups most similar to Africans are Immigrants from Lebanon (95.4%, a difference of 0.0%), Portuguese (95.5%, a difference of 0.010%), Immigrants from Sudan (95.5%, a difference of 0.020%), Immigrants from Morocco (95.4%, a difference of 0.020%), and Hawaiian (95.5%, a difference of 0.040%).
| Demographics | Rating | Rank | 8th Grade |
| Moroccans | 17.4 /100 | #203 | Poor 95.5% |
| Hawaiians | 16.7 /100 | #204 | Poor 95.5% |
| Immigrants | Bahamas | 16.7 /100 | #205 | Poor 95.5% |
| Comanche | 16.3 /100 | #206 | Poor 95.5% |
| Immigrants | Sudan | 15.1 /100 | #207 | Poor 95.5% |
| Portuguese | 14.3 /100 | #208 | Poor 95.5% |
| Immigrants | Lebanon | 13.7 /100 | #209 | Poor 95.4% |
| Africans | 13.6 /100 | #210 | Poor 95.4% |
| Immigrants | Morocco | 12.4 /100 | #211 | Poor 95.4% |
| Immigrants | Pakistan | 9.7 /100 | #212 | Tragic 95.4% |
| Laotians | 9.0 /100 | #213 | Tragic 95.4% |
| Immigrants | Chile | 9.0 /100 | #214 | Tragic 95.4% |
| Immigrants | Liberia | 8.9 /100 | #215 | Tragic 95.4% |
| Samoans | 8.4 /100 | #216 | Tragic 95.4% |
| Immigrants | Eastern Asia | 8.3 /100 | #217 | Tragic 95.4% |
Demographics Similar to Immigrants from Colombia by 8th Grade
In terms of 8th grade, the demographic groups most similar to Immigrants from Colombia are Trinidadian and Tobagonian (94.7%, a difference of 0.010%), Immigrants from Western Africa (94.8%, a difference of 0.020%), Immigrants from South America (94.8%, a difference of 0.030%), Peruvian (94.7%, a difference of 0.030%), and Immigrants from Uzbekistan (94.8%, a difference of 0.040%).
| Demographics | Rating | Rank | 8th Grade |
| Immigrants | Uruguay | 0.3 /100 | #268 | Tragic 94.8% |
| Immigrants | Thailand | 0.2 /100 | #269 | Tragic 94.8% |
| Immigrants | Uzbekistan | 0.2 /100 | #270 | Tragic 94.8% |
| Immigrants | Afghanistan | 0.2 /100 | #271 | Tragic 94.8% |
| Immigrants | South America | 0.2 /100 | #272 | Tragic 94.8% |
| Immigrants | Western Africa | 0.2 /100 | #273 | Tragic 94.8% |
| Trinidadians and Tobagonians | 0.2 /100 | #274 | Tragic 94.7% |
| Immigrants | Colombia | 0.2 /100 | #275 | Tragic 94.7% |
| Peruvians | 0.1 /100 | #276 | Tragic 94.7% |
| Taiwanese | 0.1 /100 | #277 | Tragic 94.7% |
| Armenians | 0.1 /100 | #278 | Tragic 94.7% |
| Immigrants | Trinidad and Tobago | 0.1 /100 | #279 | Tragic 94.6% |
| Barbadians | 0.1 /100 | #280 | Tragic 94.6% |
| Immigrants | Bolivia | 0.1 /100 | #281 | Tragic 94.6% |
| Immigrants | Eritrea | 0.1 /100 | #282 | Tragic 94.6% |