Guyanese vs Immigrants from Senegal 5th Grade
COMPARE
Guyanese
Immigrants from Senegal
5th Grade
5th Grade Comparison
Guyanese
Immigrants from Senegal
96.1%
5TH GRADE
0.0/ 100
METRIC RATING
302nd/ 347
METRIC RANK
96.8%
5TH GRADE
0.8/ 100
METRIC RATING
254th/ 347
METRIC RANK
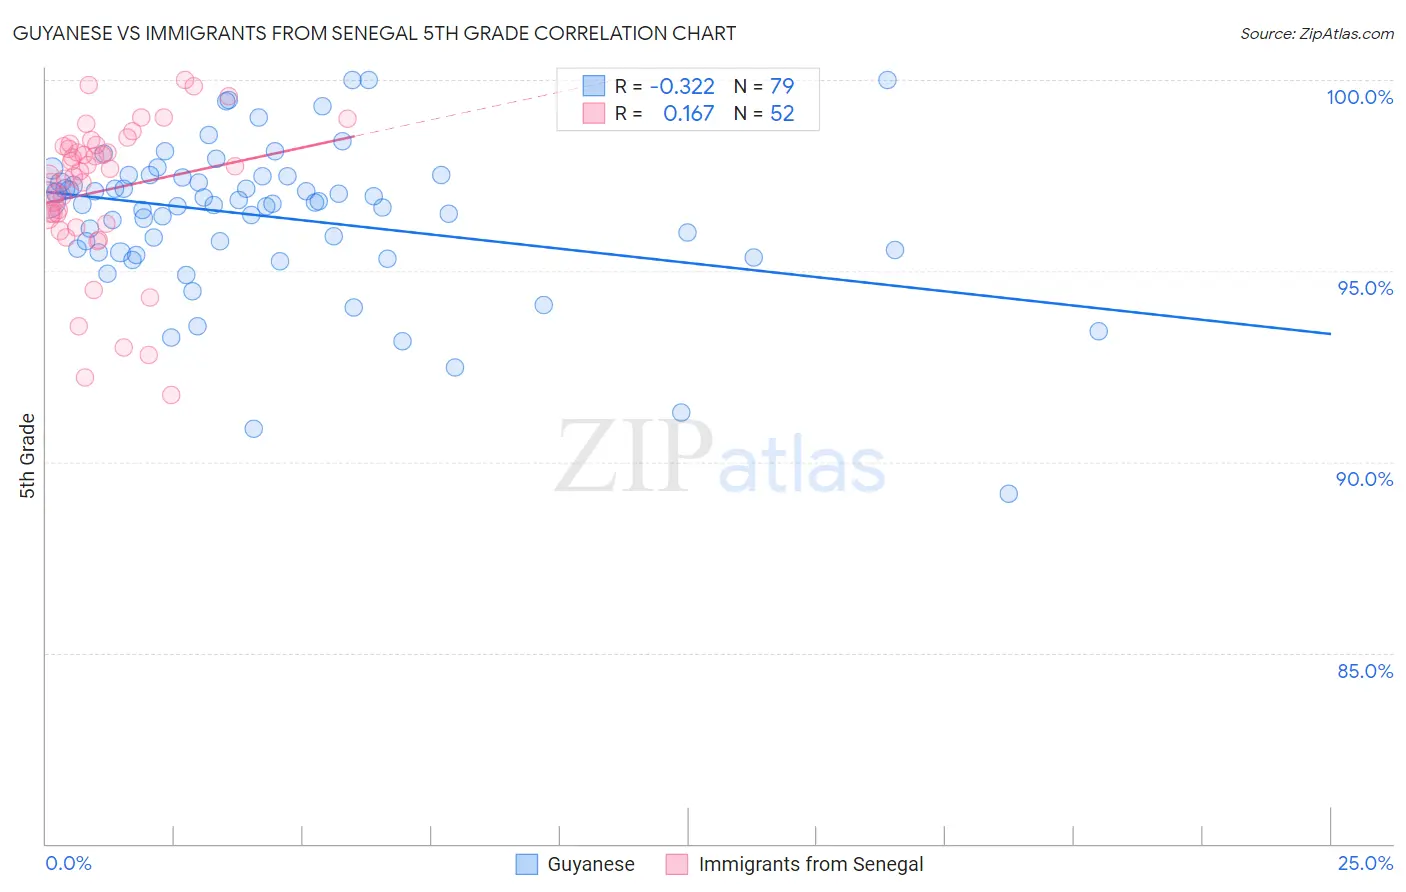
Guyanese vs Immigrants from Senegal 5th Grade Correlation Chart
The statistical analysis conducted on geographies consisting of 176,921,765 people shows a mild negative correlation between the proportion of Guyanese and percentage of population with at least 5th grade education in the United States with a correlation coefficient (R) of -0.322 and weighted average of 96.1%. Similarly, the statistical analysis conducted on geographies consisting of 90,130,297 people shows a poor positive correlation between the proportion of Immigrants from Senegal and percentage of population with at least 5th grade education in the United States with a correlation coefficient (R) of 0.167 and weighted average of 96.8%, a difference of 0.77%.
5th Grade Correlation Summary
| Measurement | Guyanese | Immigrants from Senegal |
| Minimum | 89.2% | 91.8% |
| Maximum | 100.0% | 100.0% |
| Range | 10.8% | 8.2% |
| Mean | 96.4% | 97.1% |
| Median | 96.8% | 97.6% |
| Interquartile 25% (IQ1) | 95.5% | 96.3% |
| Interquartile 75% (IQ3) | 97.5% | 98.3% |
| Interquartile Range (IQR) | 2.0% | 1.9% |
| Standard Deviation (Sample) | 2.0% | 1.9% |
| Standard Deviation (Population) | 2.0% | 1.9% |
Similar Demographics by 5th Grade
Demographics Similar to Guyanese by 5th Grade
In terms of 5th grade, the demographic groups most similar to Guyanese are Immigrants from Cuba (96.1%, a difference of 0.010%), Puerto Rican (96.1%, a difference of 0.010%), Sri Lankan (96.1%, a difference of 0.030%), Immigrants from Burma/Myanmar (96.1%, a difference of 0.040%), and Immigrants from Laos (96.0%, a difference of 0.050%).
| Demographics | Rating | Rank | 5th Grade |
| Immigrants | Somalia | 0.0 /100 | #295 | Tragic 96.4% |
| Immigrants | South Eastern Asia | 0.0 /100 | #296 | Tragic 96.3% |
| Haitians | 0.0 /100 | #297 | Tragic 96.3% |
| Immigrants | Dominica | 0.0 /100 | #298 | Tragic 96.2% |
| Immigrants | Immigrants | 0.0 /100 | #299 | Tragic 96.2% |
| Sri Lankans | 0.0 /100 | #300 | Tragic 96.1% |
| Immigrants | Cuba | 0.0 /100 | #301 | Tragic 96.1% |
| Guyanese | 0.0 /100 | #302 | Tragic 96.1% |
| Puerto Ricans | 0.0 /100 | #303 | Tragic 96.1% |
| Immigrants | Burma/Myanmar | 0.0 /100 | #304 | Tragic 96.1% |
| Immigrants | Laos | 0.0 /100 | #305 | Tragic 96.0% |
| Immigrants | Haiti | 0.0 /100 | #306 | Tragic 96.0% |
| Immigrants | Caribbean | 0.0 /100 | #307 | Tragic 96.0% |
| Ecuadorians | 0.0 /100 | #308 | Tragic 96.0% |
| Immigrants | Guyana | 0.0 /100 | #309 | Tragic 96.0% |
Demographics Similar to Immigrants from Senegal by 5th Grade
In terms of 5th grade, the demographic groups most similar to Immigrants from Senegal are Immigrants from Middle Africa (96.8%, a difference of 0.010%), Immigrants from Uruguay (96.9%, a difference of 0.020%), Immigrants from Liberia (96.9%, a difference of 0.020%), Bolivian (96.9%, a difference of 0.020%), and Jamaican (96.9%, a difference of 0.020%).
| Demographics | Rating | Rank | 5th Grade |
| Immigrants | Africa | 1.1 /100 | #247 | Tragic 96.9% |
| U.S. Virgin Islanders | 1.1 /100 | #248 | Tragic 96.9% |
| Immigrants | Uruguay | 1.0 /100 | #249 | Tragic 96.9% |
| Immigrants | Liberia | 1.0 /100 | #250 | Tragic 96.9% |
| Bolivians | 0.9 /100 | #251 | Tragic 96.9% |
| Jamaicans | 0.9 /100 | #252 | Tragic 96.9% |
| Immigrants | Middle Africa | 0.8 /100 | #253 | Tragic 96.8% |
| Immigrants | Senegal | 0.8 /100 | #254 | Tragic 96.8% |
| South Americans | 0.7 /100 | #255 | Tragic 96.8% |
| Immigrants | Congo | 0.7 /100 | #256 | Tragic 96.8% |
| Peruvians | 0.6 /100 | #257 | Tragic 96.8% |
| Immigrants | Ethiopia | 0.5 /100 | #258 | Tragic 96.8% |
| Immigrants | China | 0.5 /100 | #259 | Tragic 96.8% |
| Immigrants | Jamaica | 0.4 /100 | #260 | Tragic 96.8% |
| Immigrants | Sierra Leone | 0.4 /100 | #261 | Tragic 96.8% |