African vs Immigrants from Nepal 7th Grade
COMPARE
African
Immigrants from Nepal
7th Grade
7th Grade Comparison
Africans
Immigrants from Nepal
95.8%
7TH GRADE
17.6/ 100
METRIC RATING
206th/ 347
METRIC RANK
95.9%
7TH GRADE
30.0/ 100
METRIC RATING
194th/ 347
METRIC RANK
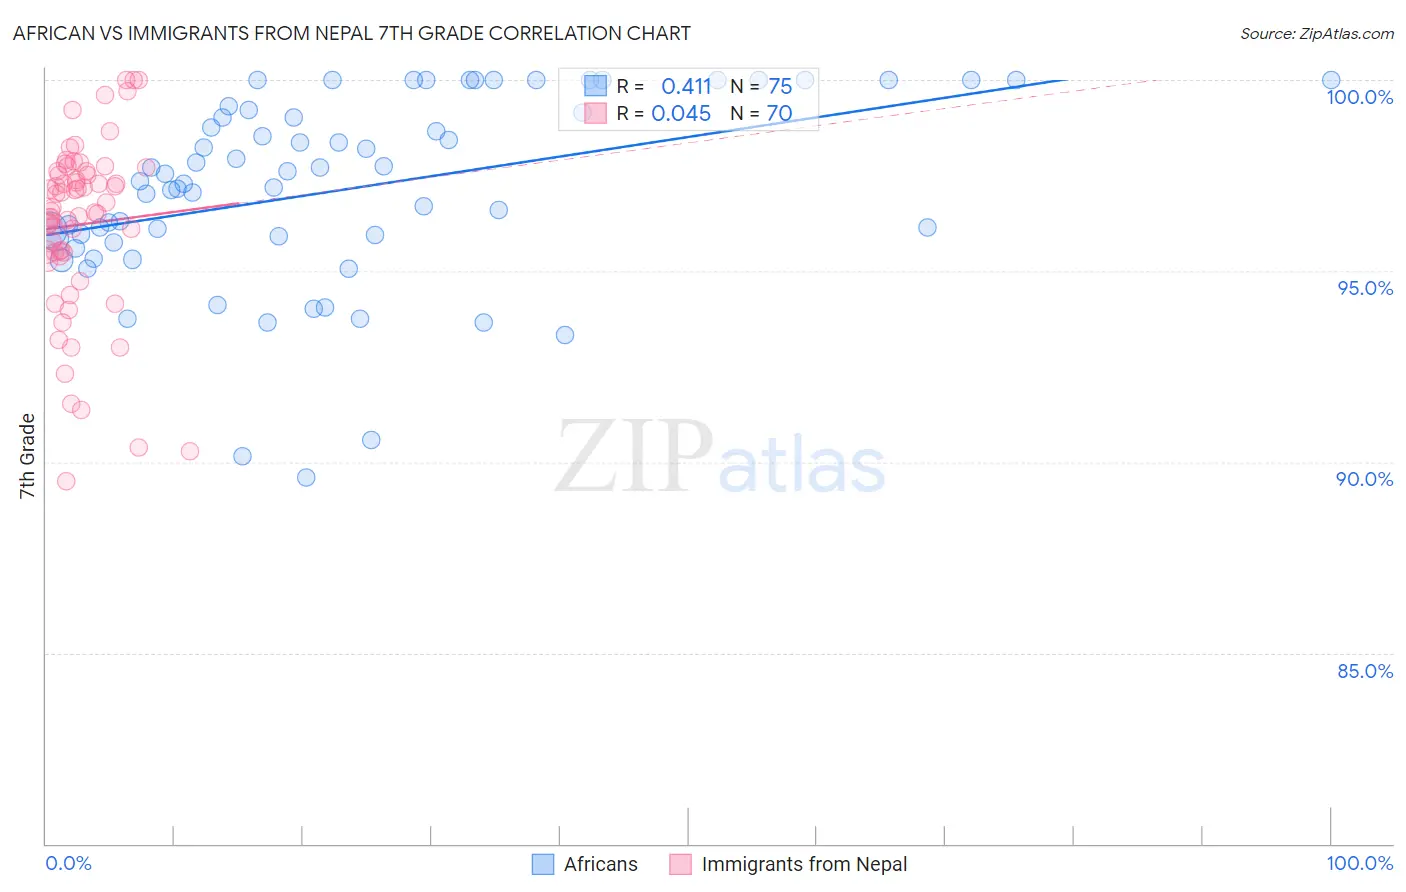
African vs Immigrants from Nepal 7th Grade Correlation Chart
The statistical analysis conducted on geographies consisting of 470,094,744 people shows a moderate positive correlation between the proportion of Africans and percentage of population with at least 7th grade education in the United States with a correlation coefficient (R) of 0.411 and weighted average of 95.8%. Similarly, the statistical analysis conducted on geographies consisting of 186,622,433 people shows no correlation between the proportion of Immigrants from Nepal and percentage of population with at least 7th grade education in the United States with a correlation coefficient (R) of 0.045 and weighted average of 95.9%, a difference of 0.11%.
7th Grade Correlation Summary
| Measurement | African | Immigrants from Nepal |
| Minimum | 89.6% | 89.5% |
| Maximum | 100.0% | 100.0% |
| Range | 10.4% | 10.5% |
| Mean | 97.1% | 96.2% |
| Median | 97.3% | 96.6% |
| Interquartile 25% (IQ1) | 95.9% | 95.5% |
| Interquartile 75% (IQ3) | 99.2% | 97.6% |
| Interquartile Range (IQR) | 3.4% | 2.1% |
| Standard Deviation (Sample) | 2.5% | 2.3% |
| Standard Deviation (Population) | 2.5% | 2.3% |
Demographics Similar to Africans and Immigrants from Nepal by 7th Grade
In terms of 7th grade, the demographic groups most similar to Africans are Moroccan (95.8%, a difference of 0.010%), Navajo (95.8%, a difference of 0.010%), Immigrants from Sudan (95.8%, a difference of 0.010%), Dutch West Indian (95.8%, a difference of 0.020%), and Hawaiian (95.8%, a difference of 0.020%). Similarly, the demographic groups most similar to Immigrants from Nepal are Immigrants from Bahamas (95.9%, a difference of 0.010%), Sudanese (95.9%, a difference of 0.010%), Immigrants from Micronesia (95.9%, a difference of 0.020%), Liberian (95.9%, a difference of 0.020%), and Panamanian (95.9%, a difference of 0.020%).
| Demographics | Rating | Rank | 7th Grade |
| Immigrants | Micronesia | 32.6 /100 | #190 | Fair 95.9% |
| Liberians | 32.5 /100 | #191 | Fair 95.9% |
| Panamanians | 32.3 /100 | #192 | Fair 95.9% |
| Immigrants | Bahamas | 30.8 /100 | #193 | Fair 95.9% |
| Immigrants | Nepal | 30.0 /100 | #194 | Fair 95.9% |
| Sudanese | 28.1 /100 | #195 | Fair 95.9% |
| Apache | 27.6 /100 | #196 | Fair 95.9% |
| Immigrants | Zaire | 26.7 /100 | #197 | Fair 95.9% |
| Paraguayans | 24.8 /100 | #198 | Fair 95.9% |
| Guamanians/Chamorros | 23.5 /100 | #199 | Fair 95.9% |
| Argentineans | 23.2 /100 | #200 | Fair 95.9% |
| Immigrants | Argentina | 21.9 /100 | #201 | Fair 95.9% |
| Immigrants | Northern Africa | 21.4 /100 | #202 | Fair 95.8% |
| Comanche | 21.1 /100 | #203 | Fair 95.8% |
| Assyrians/Chaldeans/Syriacs | 20.5 /100 | #204 | Fair 95.8% |
| Moroccans | 18.9 /100 | #205 | Poor 95.8% |
| Africans | 17.6 /100 | #206 | Poor 95.8% |
| Navajo | 17.0 /100 | #207 | Poor 95.8% |
| Immigrants | Sudan | 17.0 /100 | #208 | Poor 95.8% |
| Dutch West Indians | 16.1 /100 | #209 | Poor 95.8% |
| Hawaiians | 16.0 /100 | #210 | Poor 95.8% |