Burmese vs Cree 10th Grade
COMPARE
Burmese
Cree
10th Grade
10th Grade Comparison
Burmese
Cree
94.5%
10TH GRADE
97.1/ 100
METRIC RATING
110th/ 347
METRIC RANK
94.4%
10TH GRADE
95.1/ 100
METRIC RATING
123rd/ 347
METRIC RANK
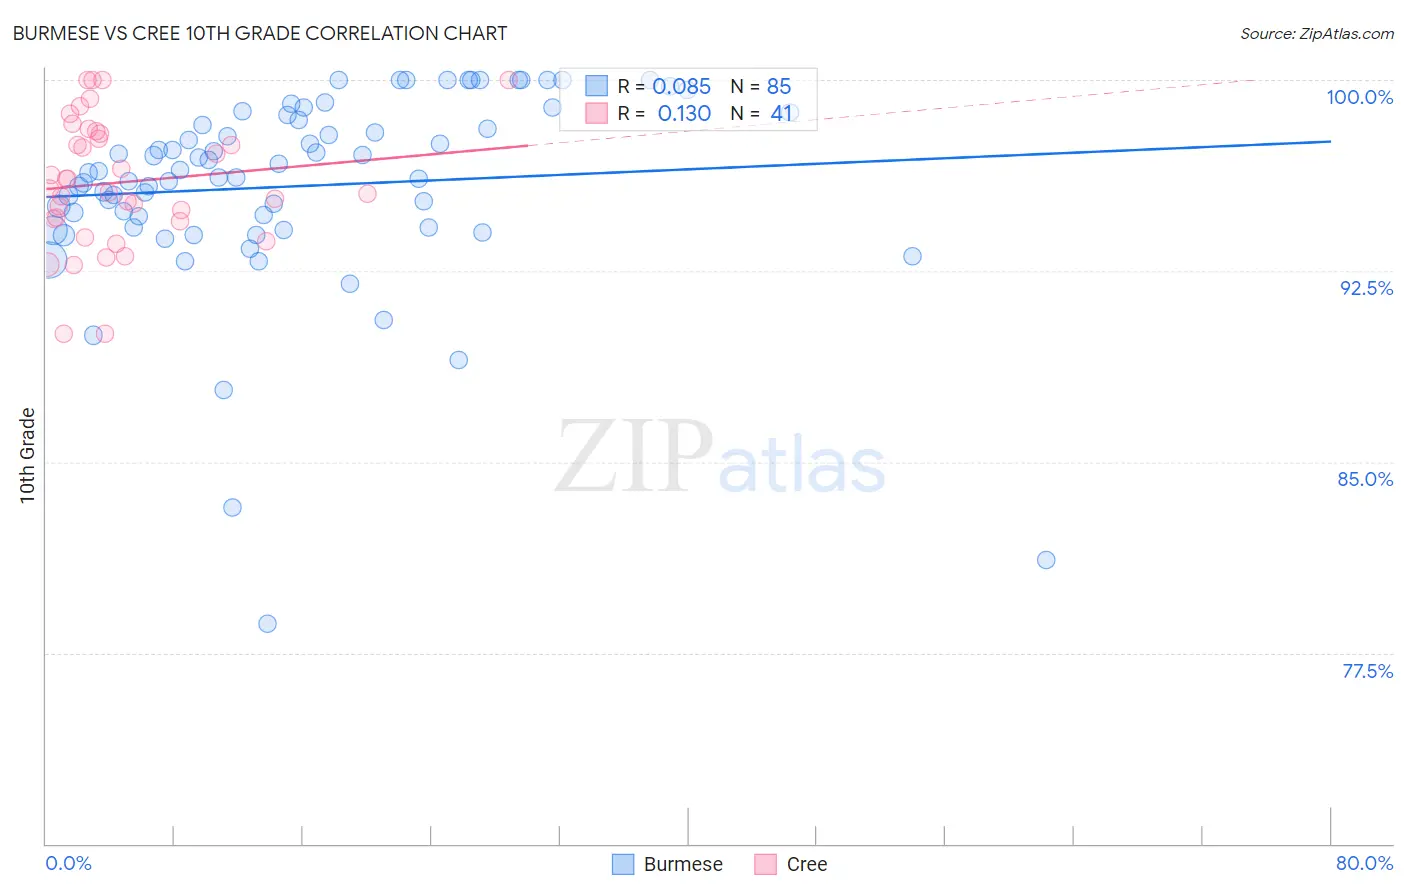
Burmese vs Cree 10th Grade Correlation Chart
The statistical analysis conducted on geographies consisting of 465,370,495 people shows a slight positive correlation between the proportion of Burmese and percentage of population with at least 10th grade education in the United States with a correlation coefficient (R) of 0.085 and weighted average of 94.5%. Similarly, the statistical analysis conducted on geographies consisting of 76,211,744 people shows a poor positive correlation between the proportion of Cree and percentage of population with at least 10th grade education in the United States with a correlation coefficient (R) of 0.130 and weighted average of 94.4%, a difference of 0.12%.
10th Grade Correlation Summary
| Measurement | Burmese | Cree |
| Minimum | 78.7% | 90.0% |
| Maximum | 100.0% | 100.0% |
| Range | 21.3% | 10.0% |
| Mean | 95.8% | 96.0% |
| Median | 96.4% | 95.7% |
| Interquartile 25% (IQ1) | 94.2% | 94.5% |
| Interquartile 75% (IQ3) | 98.5% | 97.9% |
| Interquartile Range (IQR) | 4.3% | 3.4% |
| Standard Deviation (Sample) | 3.9% | 2.5% |
| Standard Deviation (Population) | 3.9% | 2.5% |
Demographics Similar to Burmese and Cree by 10th Grade
In terms of 10th grade, the demographic groups most similar to Burmese are Immigrants from North Macedonia (94.5%, a difference of 0.010%), Immigrants from Norway (94.5%, a difference of 0.010%), Immigrants from Serbia (94.5%, a difference of 0.020%), Immigrants from Croatia (94.5%, a difference of 0.020%), and Immigrants from Zimbabwe (94.4%, a difference of 0.020%). Similarly, the demographic groups most similar to Cree are Immigrants from Belarus (94.4%, a difference of 0.0%), Inupiat (94.4%, a difference of 0.0%), Immigrants from Taiwan (94.4%, a difference of 0.010%), Basque (94.3%, a difference of 0.010%), and Jordanian (94.4%, a difference of 0.020%).
| Demographics | Rating | Rank | 10th Grade |
| Immigrants | Serbia | 97.4 /100 | #106 | Exceptional 94.5% |
| Immigrants | Croatia | 97.4 /100 | #107 | Exceptional 94.5% |
| Immigrants | North Macedonia | 97.2 /100 | #108 | Exceptional 94.5% |
| Immigrants | Norway | 97.2 /100 | #109 | Exceptional 94.5% |
| Burmese | 97.1 /100 | #110 | Exceptional 94.5% |
| Immigrants | Zimbabwe | 96.8 /100 | #111 | Exceptional 94.4% |
| Immigrants | Kuwait | 96.8 /100 | #112 | Exceptional 94.4% |
| Palestinians | 96.5 /100 | #113 | Exceptional 94.4% |
| German Russians | 96.3 /100 | #114 | Exceptional 94.4% |
| Delaware | 96.3 /100 | #115 | Exceptional 94.4% |
| Sioux | 96.2 /100 | #116 | Exceptional 94.4% |
| Immigrants | Hungary | 95.8 /100 | #117 | Exceptional 94.4% |
| Jordanians | 95.6 /100 | #118 | Exceptional 94.4% |
| Immigrants | Israel | 95.4 /100 | #119 | Exceptional 94.4% |
| Immigrants | Taiwan | 95.3 /100 | #120 | Exceptional 94.4% |
| Immigrants | Belarus | 95.2 /100 | #121 | Exceptional 94.4% |
| Inupiat | 95.1 /100 | #122 | Exceptional 94.4% |
| Cree | 95.1 /100 | #123 | Exceptional 94.4% |
| Basques | 94.9 /100 | #124 | Exceptional 94.3% |
| Americans | 94.4 /100 | #125 | Exceptional 94.3% |
| Immigrants | Iran | 94.4 /100 | #126 | Exceptional 94.3% |