Afghan vs Pakistani Nursery School
COMPARE
Afghan
Pakistani
Nursery School
Nursery School Comparison
Afghans
Pakistanis
97.4%
NURSERY SCHOOL
0.0/ 100
METRIC RATING
282nd/ 347
METRIC RANK
97.9%
NURSERY SCHOOL
34.6/ 100
METRIC RATING
189th/ 347
METRIC RANK
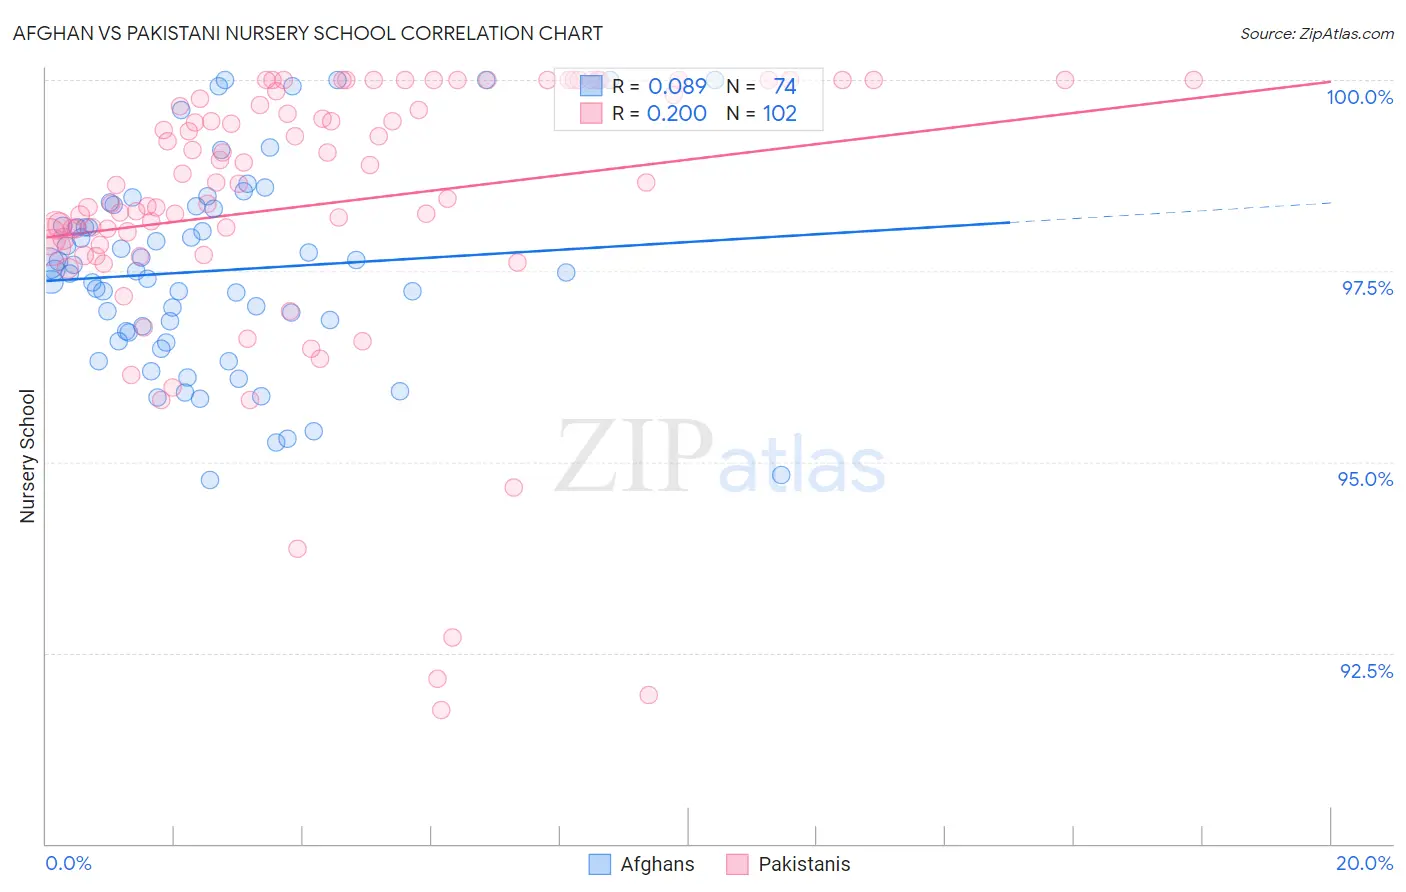
Afghan vs Pakistani Nursery School Correlation Chart
The statistical analysis conducted on geographies consisting of 148,851,685 people shows a slight positive correlation between the proportion of Afghans and percentage of population with at least nursery school education in the United States with a correlation coefficient (R) of 0.089 and weighted average of 97.4%. Similarly, the statistical analysis conducted on geographies consisting of 335,355,426 people shows a poor positive correlation between the proportion of Pakistanis and percentage of population with at least nursery school education in the United States with a correlation coefficient (R) of 0.200 and weighted average of 97.9%, a difference of 0.53%.
Nursery School Correlation Summary
| Measurement | Afghan | Pakistani |
| Minimum | 94.8% | 91.8% |
| Maximum | 100.0% | 100.0% |
| Range | 5.2% | 8.2% |
| Mean | 97.5% | 98.4% |
| Median | 97.5% | 98.6% |
| Interquartile 25% (IQ1) | 96.7% | 97.8% |
| Interquartile 75% (IQ3) | 98.3% | 99.8% |
| Interquartile Range (IQR) | 1.6% | 2.0% |
| Standard Deviation (Sample) | 1.3% | 1.8% |
| Standard Deviation (Population) | 1.3% | 1.8% |
Similar Demographics by Nursery School
Demographics Similar to Afghans by Nursery School
In terms of nursery school, the demographic groups most similar to Afghans are Barbadian (97.4%, a difference of 0.0%), Trinidadian and Tobagonian (97.4%, a difference of 0.0%), Immigrants from Ghana (97.4%, a difference of 0.010%), Immigrants from Uzbekistan (97.4%, a difference of 0.020%), and Immigrants from Western Africa (97.4%, a difference of 0.030%).
| Demographics | Rating | Rank | Nursery School |
| Ghanaians | 0.1 /100 | #275 | Tragic 97.5% |
| Immigrants | Philippines | 0.1 /100 | #276 | Tragic 97.5% |
| Immigrants | Western Africa | 0.1 /100 | #277 | Tragic 97.4% |
| Immigrants | Uzbekistan | 0.1 /100 | #278 | Tragic 97.4% |
| Immigrants | Ghana | 0.1 /100 | #279 | Tragic 97.4% |
| Barbadians | 0.0 /100 | #280 | Tragic 97.4% |
| Trinidadians and Tobagonians | 0.0 /100 | #281 | Tragic 97.4% |
| Afghans | 0.0 /100 | #282 | Tragic 97.4% |
| Immigrants | West Indies | 0.0 /100 | #283 | Tragic 97.4% |
| Immigrants | Trinidad and Tobago | 0.0 /100 | #284 | Tragic 97.4% |
| Immigrants | Barbados | 0.0 /100 | #285 | Tragic 97.4% |
| Immigrants | Portugal | 0.0 /100 | #286 | Tragic 97.4% |
| Immigrants | Hong Kong | 0.0 /100 | #287 | Tragic 97.4% |
| Immigrants | Thailand | 0.0 /100 | #288 | Tragic 97.3% |
| Immigrants | St. Vincent and the Grenadines | 0.0 /100 | #289 | Tragic 97.3% |
Demographics Similar to Pakistanis by Nursery School
In terms of nursery school, the demographic groups most similar to Pakistanis are Arab (97.9%, a difference of 0.0%), Panamanian (97.9%, a difference of 0.0%), Immigrants from Kazakhstan (97.9%, a difference of 0.010%), Immigrants from Taiwan (97.9%, a difference of 0.010%), and Paiute (98.0%, a difference of 0.020%).
| Demographics | Rating | Rank | Nursery School |
| Paiute | 42.0 /100 | #182 | Average 98.0% |
| Portuguese | 41.8 /100 | #183 | Average 98.0% |
| Immigrants | Poland | 41.3 /100 | #184 | Average 98.0% |
| Immigrants | Belarus | 41.0 /100 | #185 | Average 98.0% |
| Immigrants | Argentina | 40.8 /100 | #186 | Average 98.0% |
| Immigrants | Kazakhstan | 37.1 /100 | #187 | Fair 97.9% |
| Arabs | 34.7 /100 | #188 | Fair 97.9% |
| Pakistanis | 34.6 /100 | #189 | Fair 97.9% |
| Panamanians | 34.3 /100 | #190 | Fair 97.9% |
| Immigrants | Taiwan | 30.6 /100 | #191 | Fair 97.9% |
| Blacks/African Americans | 29.4 /100 | #192 | Fair 97.9% |
| Paraguayans | 27.4 /100 | #193 | Fair 97.9% |
| Mongolians | 27.3 /100 | #194 | Fair 97.9% |
| Hawaiians | 27.2 /100 | #195 | Fair 97.9% |
| Guamanians/Chamorros | 25.7 /100 | #196 | Fair 97.9% |