Immigrants from Caribbean vs Pakistani Nursery School
COMPARE
Immigrants from Caribbean
Pakistani
Nursery School
Nursery School Comparison
Immigrants from Caribbean
Pakistanis
97.1%
NURSERY SCHOOL
0.0/ 100
METRIC RATING
302nd/ 347
METRIC RANK
97.9%
NURSERY SCHOOL
34.6/ 100
METRIC RATING
189th/ 347
METRIC RANK
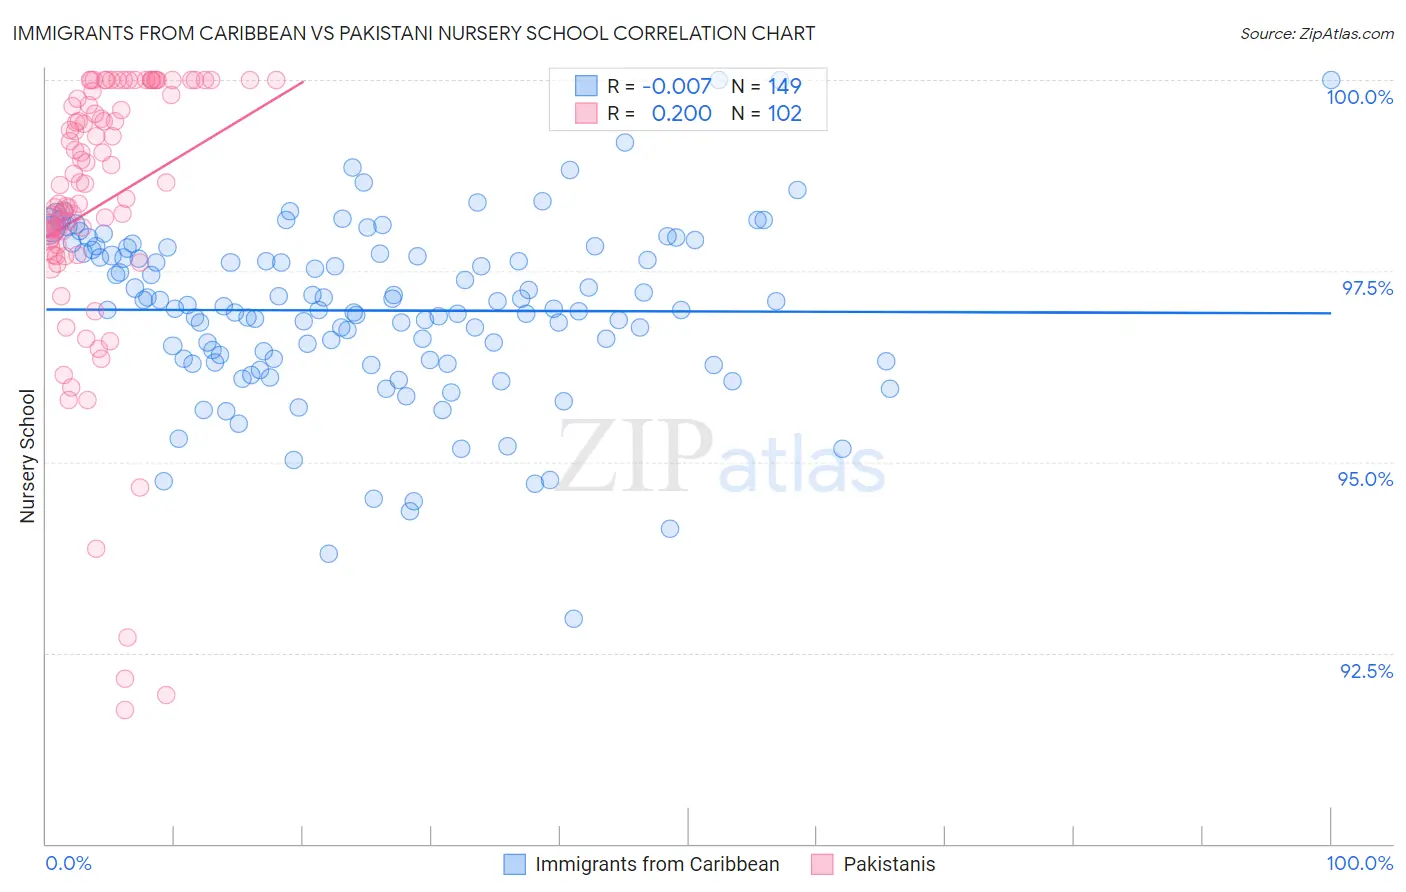
Immigrants from Caribbean vs Pakistani Nursery School Correlation Chart
The statistical analysis conducted on geographies consisting of 450,023,263 people shows no correlation between the proportion of Immigrants from Caribbean and percentage of population with at least nursery school education in the United States with a correlation coefficient (R) of -0.007 and weighted average of 97.1%. Similarly, the statistical analysis conducted on geographies consisting of 335,355,426 people shows a poor positive correlation between the proportion of Pakistanis and percentage of population with at least nursery school education in the United States with a correlation coefficient (R) of 0.200 and weighted average of 97.9%, a difference of 0.85%.
Nursery School Correlation Summary
| Measurement | Immigrants from Caribbean | Pakistani |
| Minimum | 93.0% | 91.8% |
| Maximum | 100.0% | 100.0% |
| Range | 7.0% | 8.2% |
| Mean | 97.0% | 98.4% |
| Median | 97.0% | 98.6% |
| Interquartile 25% (IQ1) | 96.3% | 97.8% |
| Interquartile 75% (IQ3) | 97.8% | 99.8% |
| Interquartile Range (IQR) | 1.4% | 2.0% |
| Standard Deviation (Sample) | 1.2% | 1.8% |
| Standard Deviation (Population) | 1.2% | 1.8% |
Similar Demographics by Nursery School
Demographics Similar to Immigrants from Caribbean by Nursery School
In terms of nursery school, the demographic groups most similar to Immigrants from Caribbean are Immigrants from South Eastern Asia (97.1%, a difference of 0.030%), Nicaraguan (97.1%, a difference of 0.030%), Ecuadorian (97.1%, a difference of 0.040%), Somali (97.1%, a difference of 0.040%), and Haitian (97.2%, a difference of 0.060%).
| Demographics | Rating | Rank | Nursery School |
| Immigrants | Immigrants | 0.0 /100 | #295 | Tragic 97.2% |
| Immigrants | Eritrea | 0.0 /100 | #296 | Tragic 97.2% |
| Immigrants | Cuba | 0.0 /100 | #297 | Tragic 97.2% |
| Central American Indians | 0.0 /100 | #298 | Tragic 97.2% |
| Immigrants | Dominica | 0.0 /100 | #299 | Tragic 97.2% |
| Haitians | 0.0 /100 | #300 | Tragic 97.2% |
| Immigrants | South Eastern Asia | 0.0 /100 | #301 | Tragic 97.1% |
| Immigrants | Caribbean | 0.0 /100 | #302 | Tragic 97.1% |
| Nicaraguans | 0.0 /100 | #303 | Tragic 97.1% |
| Ecuadorians | 0.0 /100 | #304 | Tragic 97.1% |
| Somalis | 0.0 /100 | #305 | Tragic 97.1% |
| Belizeans | 0.0 /100 | #306 | Tragic 97.0% |
| Hispanics or Latinos | 0.0 /100 | #307 | Tragic 97.0% |
| Immigrants | Haiti | 0.0 /100 | #308 | Tragic 97.0% |
| Immigrants | Somalia | 0.0 /100 | #309 | Tragic 97.0% |
Demographics Similar to Pakistanis by Nursery School
In terms of nursery school, the demographic groups most similar to Pakistanis are Arab (97.9%, a difference of 0.0%), Panamanian (97.9%, a difference of 0.0%), Immigrants from Kazakhstan (97.9%, a difference of 0.010%), Immigrants from Taiwan (97.9%, a difference of 0.010%), and Paiute (98.0%, a difference of 0.020%).
| Demographics | Rating | Rank | Nursery School |
| Paiute | 42.0 /100 | #182 | Average 98.0% |
| Portuguese | 41.8 /100 | #183 | Average 98.0% |
| Immigrants | Poland | 41.3 /100 | #184 | Average 98.0% |
| Immigrants | Belarus | 41.0 /100 | #185 | Average 98.0% |
| Immigrants | Argentina | 40.8 /100 | #186 | Average 98.0% |
| Immigrants | Kazakhstan | 37.1 /100 | #187 | Fair 97.9% |
| Arabs | 34.7 /100 | #188 | Fair 97.9% |
| Pakistanis | 34.6 /100 | #189 | Fair 97.9% |
| Panamanians | 34.3 /100 | #190 | Fair 97.9% |
| Immigrants | Taiwan | 30.6 /100 | #191 | Fair 97.9% |
| Blacks/African Americans | 29.4 /100 | #192 | Fair 97.9% |
| Paraguayans | 27.4 /100 | #193 | Fair 97.9% |
| Mongolians | 27.3 /100 | #194 | Fair 97.9% |
| Hawaiians | 27.2 /100 | #195 | Fair 97.9% |
| Guamanians/Chamorros | 25.7 /100 | #196 | Fair 97.9% |