Immigrants from Chile vs Pakistani Nursery School
COMPARE
Immigrants from Chile
Pakistani
Nursery School
Nursery School Comparison
Immigrants from Chile
Pakistanis
97.9%
NURSERY SCHOOL
17.3/ 100
METRIC RATING
205th/ 347
METRIC RANK
97.9%
NURSERY SCHOOL
34.6/ 100
METRIC RATING
189th/ 347
METRIC RANK
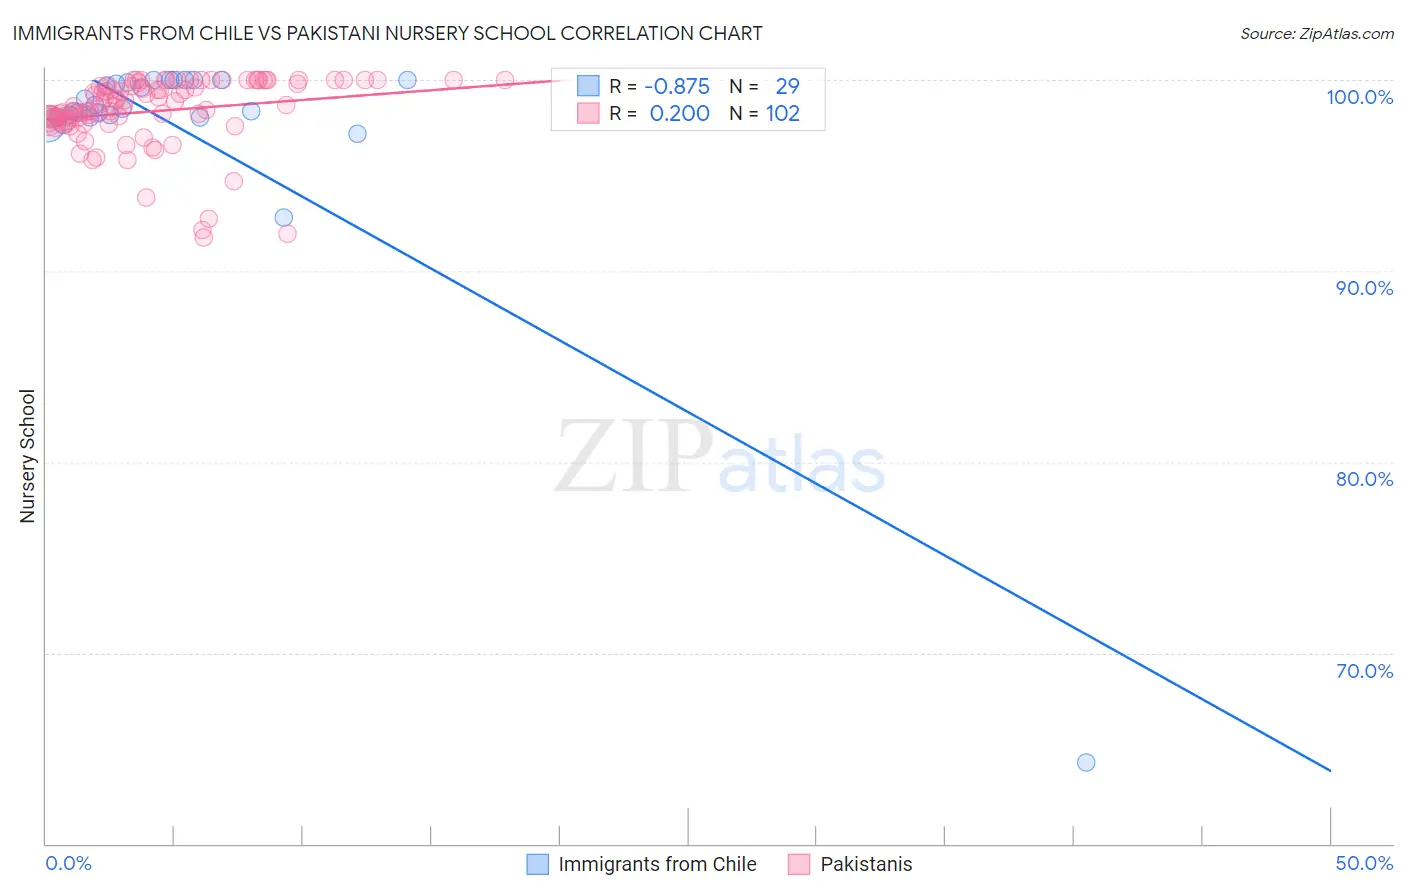
Immigrants from Chile vs Pakistani Nursery School Correlation Chart
The statistical analysis conducted on geographies consisting of 218,647,266 people shows a very strong negative correlation between the proportion of Immigrants from Chile and percentage of population with at least nursery school education in the United States with a correlation coefficient (R) of -0.875 and weighted average of 97.9%. Similarly, the statistical analysis conducted on geographies consisting of 335,355,426 people shows a poor positive correlation between the proportion of Pakistanis and percentage of population with at least nursery school education in the United States with a correlation coefficient (R) of 0.200 and weighted average of 97.9%, a difference of 0.070%.
Nursery School Correlation Summary
| Measurement | Immigrants from Chile | Pakistani |
| Minimum | 64.3% | 91.8% |
| Maximum | 100.0% | 100.0% |
| Range | 35.7% | 8.2% |
| Mean | 97.5% | 98.4% |
| Median | 98.4% | 98.6% |
| Interquartile 25% (IQ1) | 98.0% | 97.8% |
| Interquartile 75% (IQ3) | 99.9% | 99.8% |
| Interquartile Range (IQR) | 1.9% | 2.0% |
| Standard Deviation (Sample) | 6.5% | 1.8% |
| Standard Deviation (Population) | 6.4% | 1.8% |
Demographics Similar to Immigrants from Chile and Pakistanis by Nursery School
In terms of nursery school, the demographic groups most similar to Immigrants from Chile are Immigrants from Uganda (97.9%, a difference of 0.0%), Immigrants from Southern Europe (97.9%, a difference of 0.0%), Immigrants from Albania (97.9%, a difference of 0.0%), Immigrants from Ukraine (97.9%, a difference of 0.010%), and African (97.9%, a difference of 0.010%). Similarly, the demographic groups most similar to Pakistanis are Arab (97.9%, a difference of 0.0%), Panamanian (97.9%, a difference of 0.0%), Immigrants from Kazakhstan (97.9%, a difference of 0.010%), Immigrants from Taiwan (97.9%, a difference of 0.010%), and Black/African American (97.9%, a difference of 0.020%).
| Demographics | Rating | Rank | Nursery School |
| Immigrants | Kazakhstan | 37.1 /100 | #187 | Fair 97.9% |
| Arabs | 34.7 /100 | #188 | Fair 97.9% |
| Pakistanis | 34.6 /100 | #189 | Fair 97.9% |
| Panamanians | 34.3 /100 | #190 | Fair 97.9% |
| Immigrants | Taiwan | 30.6 /100 | #191 | Fair 97.9% |
| Blacks/African Americans | 29.4 /100 | #192 | Fair 97.9% |
| Paraguayans | 27.4 /100 | #193 | Fair 97.9% |
| Mongolians | 27.3 /100 | #194 | Fair 97.9% |
| Hawaiians | 27.2 /100 | #195 | Fair 97.9% |
| Guamanians/Chamorros | 25.7 /100 | #196 | Fair 97.9% |
| Yuman | 25.7 /100 | #197 | Fair 97.9% |
| Immigrants | Kenya | 24.1 /100 | #198 | Fair 97.9% |
| Immigrants | Egypt | 22.5 /100 | #199 | Fair 97.9% |
| Tohono O'odham | 22.2 /100 | #200 | Fair 97.9% |
| Immigrants | Lebanon | 21.2 /100 | #201 | Fair 97.9% |
| Immigrants | Ukraine | 19.9 /100 | #202 | Poor 97.9% |
| Immigrants | Uganda | 18.0 /100 | #203 | Poor 97.9% |
| Immigrants | Southern Europe | 17.4 /100 | #204 | Poor 97.9% |
| Immigrants | Chile | 17.3 /100 | #205 | Poor 97.9% |
| Immigrants | Albania | 16.4 /100 | #206 | Poor 97.9% |
| Africans | 15.4 /100 | #207 | Poor 97.9% |