Immigrants from Hong Kong vs Pakistani Nursery School
COMPARE
Immigrants from Hong Kong
Pakistani
Nursery School
Nursery School Comparison
Immigrants from Hong Kong
Pakistanis
97.4%
NURSERY SCHOOL
0.0/ 100
METRIC RATING
287th/ 347
METRIC RANK
97.9%
NURSERY SCHOOL
34.6/ 100
METRIC RATING
189th/ 347
METRIC RANK
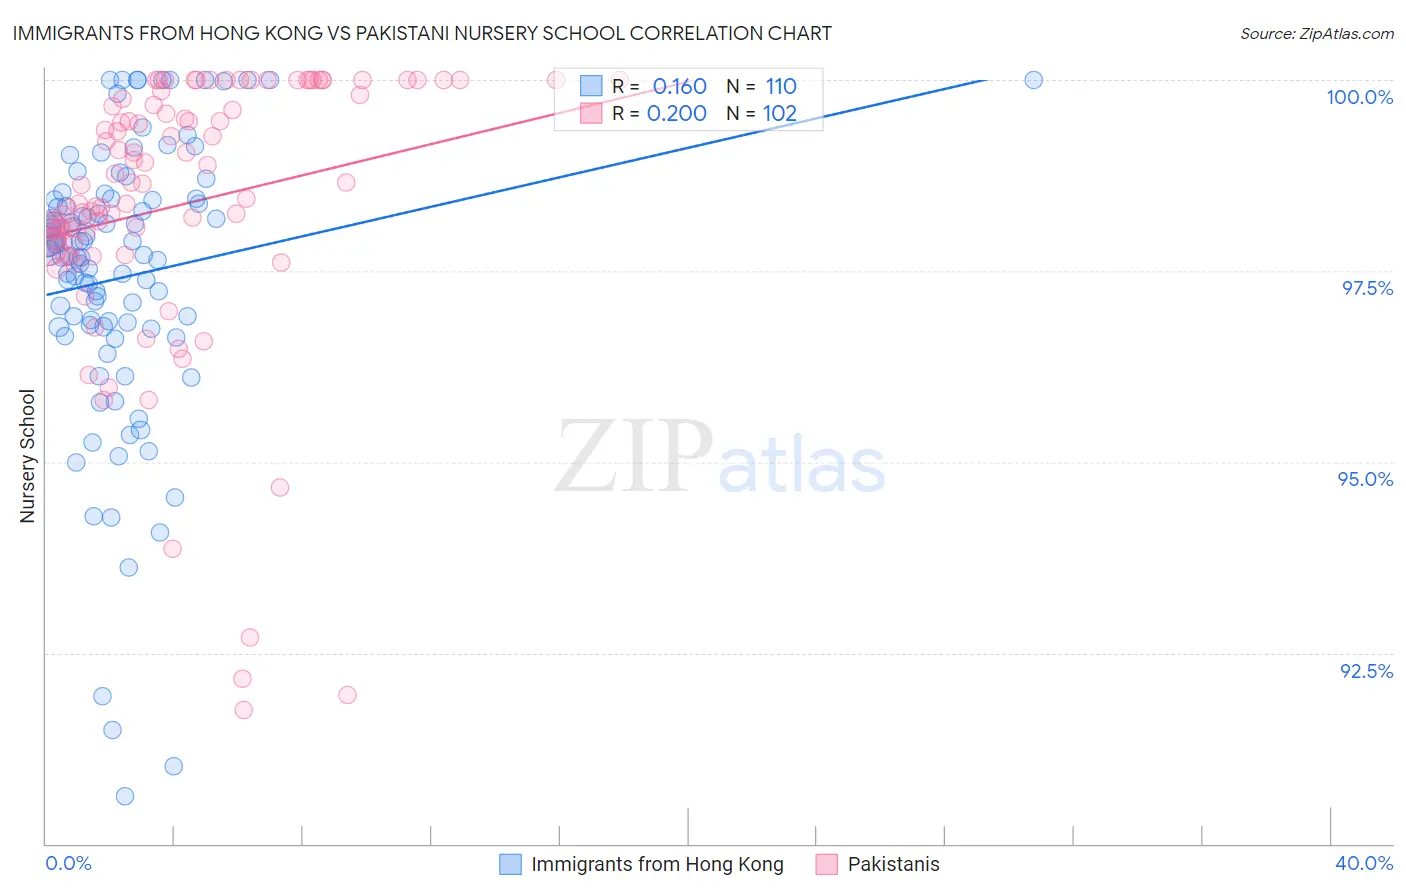
Immigrants from Hong Kong vs Pakistani Nursery School Correlation Chart
The statistical analysis conducted on geographies consisting of 253,948,669 people shows a poor positive correlation between the proportion of Immigrants from Hong Kong and percentage of population with at least nursery school education in the United States with a correlation coefficient (R) of 0.160 and weighted average of 97.4%. Similarly, the statistical analysis conducted on geographies consisting of 335,355,426 people shows a poor positive correlation between the proportion of Pakistanis and percentage of population with at least nursery school education in the United States with a correlation coefficient (R) of 0.200 and weighted average of 97.9%, a difference of 0.60%.
Nursery School Correlation Summary
| Measurement | Immigrants from Hong Kong | Pakistani |
| Minimum | 90.6% | 91.8% |
| Maximum | 100.0% | 100.0% |
| Range | 9.4% | 8.2% |
| Mean | 97.4% | 98.4% |
| Median | 97.7% | 98.6% |
| Interquartile 25% (IQ1) | 96.8% | 97.8% |
| Interquartile 75% (IQ3) | 98.4% | 99.8% |
| Interquartile Range (IQR) | 1.7% | 2.0% |
| Standard Deviation (Sample) | 1.9% | 1.8% |
| Standard Deviation (Population) | 1.9% | 1.8% |
Similar Demographics by Nursery School
Demographics Similar to Immigrants from Hong Kong by Nursery School
In terms of nursery school, the demographic groups most similar to Immigrants from Hong Kong are Immigrants from Barbados (97.4%, a difference of 0.010%), Immigrants from Portugal (97.4%, a difference of 0.010%), Immigrants from Thailand (97.3%, a difference of 0.020%), Immigrants from West Indies (97.4%, a difference of 0.030%), and Immigrants from Trinidad and Tobago (97.4%, a difference of 0.030%).
| Demographics | Rating | Rank | Nursery School |
| Barbadians | 0.0 /100 | #280 | Tragic 97.4% |
| Trinidadians and Tobagonians | 0.0 /100 | #281 | Tragic 97.4% |
| Afghans | 0.0 /100 | #282 | Tragic 97.4% |
| Immigrants | West Indies | 0.0 /100 | #283 | Tragic 97.4% |
| Immigrants | Trinidad and Tobago | 0.0 /100 | #284 | Tragic 97.4% |
| Immigrants | Barbados | 0.0 /100 | #285 | Tragic 97.4% |
| Immigrants | Portugal | 0.0 /100 | #286 | Tragic 97.4% |
| Immigrants | Hong Kong | 0.0 /100 | #287 | Tragic 97.4% |
| Immigrants | Thailand | 0.0 /100 | #288 | Tragic 97.3% |
| Immigrants | St. Vincent and the Grenadines | 0.0 /100 | #289 | Tragic 97.3% |
| Immigrants | Afghanistan | 0.0 /100 | #290 | Tragic 97.3% |
| British West Indians | 0.0 /100 | #291 | Tragic 97.3% |
| Houma | 0.0 /100 | #292 | Tragic 97.3% |
| Malaysians | 0.0 /100 | #293 | Tragic 97.3% |
| Immigrants | Grenada | 0.0 /100 | #294 | Tragic 97.3% |
Demographics Similar to Pakistanis by Nursery School
In terms of nursery school, the demographic groups most similar to Pakistanis are Arab (97.9%, a difference of 0.0%), Panamanian (97.9%, a difference of 0.0%), Immigrants from Kazakhstan (97.9%, a difference of 0.010%), Immigrants from Taiwan (97.9%, a difference of 0.010%), and Paiute (98.0%, a difference of 0.020%).
| Demographics | Rating | Rank | Nursery School |
| Paiute | 42.0 /100 | #182 | Average 98.0% |
| Portuguese | 41.8 /100 | #183 | Average 98.0% |
| Immigrants | Poland | 41.3 /100 | #184 | Average 98.0% |
| Immigrants | Belarus | 41.0 /100 | #185 | Average 98.0% |
| Immigrants | Argentina | 40.8 /100 | #186 | Average 98.0% |
| Immigrants | Kazakhstan | 37.1 /100 | #187 | Fair 97.9% |
| Arabs | 34.7 /100 | #188 | Fair 97.9% |
| Pakistanis | 34.6 /100 | #189 | Fair 97.9% |
| Panamanians | 34.3 /100 | #190 | Fair 97.9% |
| Immigrants | Taiwan | 30.6 /100 | #191 | Fair 97.9% |
| Blacks/African Americans | 29.4 /100 | #192 | Fair 97.9% |
| Paraguayans | 27.4 /100 | #193 | Fair 97.9% |
| Mongolians | 27.3 /100 | #194 | Fair 97.9% |
| Hawaiians | 27.2 /100 | #195 | Fair 97.9% |
| Guamanians/Chamorros | 25.7 /100 | #196 | Fair 97.9% |