Afghan vs Immigrants from Spain GED/Equivalency
COMPARE
Afghan
Immigrants from Spain
GED/Equivalency
GED/Equivalency Comparison
Afghans
Immigrants from Spain
85.9%
GED/EQUIVALENCY
59.7/ 100
METRIC RATING
170th/ 347
METRIC RANK
86.7%
GED/EQUIVALENCY
88.5/ 100
METRIC RATING
131st/ 347
METRIC RANK
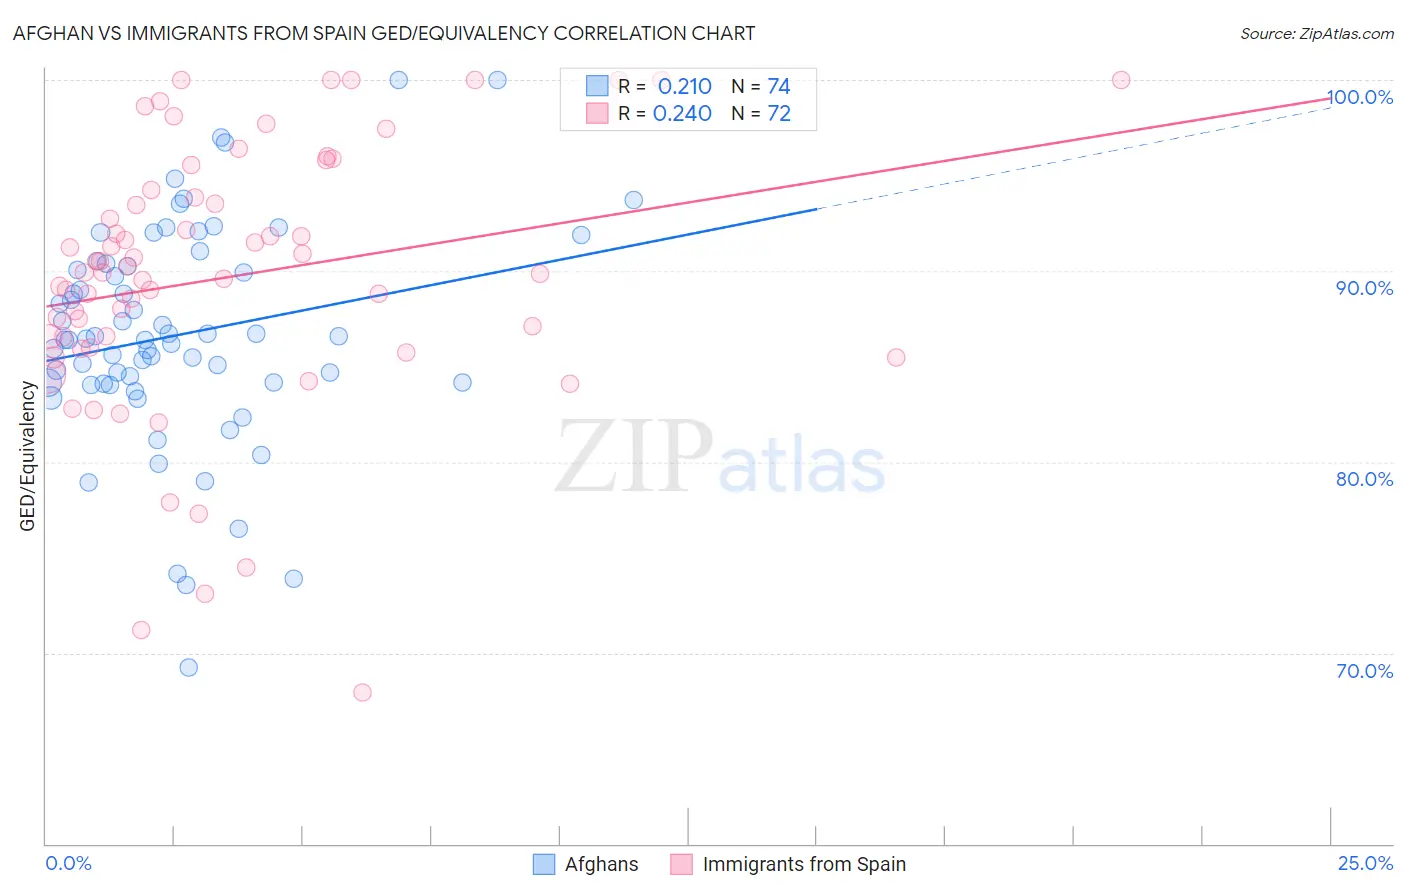
Afghan vs Immigrants from Spain GED/Equivalency Correlation Chart
The statistical analysis conducted on geographies consisting of 148,851,685 people shows a weak positive correlation between the proportion of Afghans and percentage of population with at least ged/equivalency education in the United States with a correlation coefficient (R) of 0.210 and weighted average of 85.9%. Similarly, the statistical analysis conducted on geographies consisting of 239,682,725 people shows a weak positive correlation between the proportion of Immigrants from Spain and percentage of population with at least ged/equivalency education in the United States with a correlation coefficient (R) of 0.240 and weighted average of 86.7%, a difference of 0.84%.
GED/Equivalency Correlation Summary
| Measurement | Afghan | Immigrants from Spain |
| Minimum | 69.2% | 67.9% |
| Maximum | 100.0% | 100.0% |
| Range | 30.8% | 32.1% |
| Mean | 86.7% | 89.7% |
| Median | 86.4% | 89.9% |
| Interquartile 25% (IQ1) | 84.1% | 86.3% |
| Interquartile 75% (IQ3) | 90.3% | 94.1% |
| Interquartile Range (IQR) | 6.1% | 7.8% |
| Standard Deviation (Sample) | 5.7% | 7.0% |
| Standard Deviation (Population) | 5.7% | 6.9% |
Similar Demographics by GED/Equivalency
Demographics Similar to Afghans by GED/Equivalency
In terms of ged/equivalency, the demographic groups most similar to Afghans are Immigrants from Ethiopia (86.0%, a difference of 0.030%), Sierra Leonean (86.0%, a difference of 0.050%), Immigrants from Chile (85.9%, a difference of 0.050%), Ethiopian (86.0%, a difference of 0.090%), and Alsatian (86.0%, a difference of 0.10%).
| Demographics | Rating | Rank | GED/Equivalency |
| Ugandans | 66.3 /100 | #163 | Good 86.1% |
| Venezuelans | 65.5 /100 | #164 | Good 86.0% |
| Alsatians | 64.3 /100 | #165 | Good 86.0% |
| Immigrants | Albania | 64.2 /100 | #166 | Good 86.0% |
| Ethiopians | 63.7 /100 | #167 | Good 86.0% |
| Sierra Leoneans | 61.8 /100 | #168 | Good 86.0% |
| Immigrants | Ethiopia | 61.2 /100 | #169 | Good 86.0% |
| Afghans | 59.7 /100 | #170 | Average 85.9% |
| Immigrants | Chile | 57.3 /100 | #171 | Average 85.9% |
| Bermudans | 55.1 /100 | #172 | Average 85.8% |
| Immigrants | Venezuela | 50.7 /100 | #173 | Average 85.8% |
| Ottawa | 50.0 /100 | #174 | Average 85.8% |
| Immigrants | Bolivia | 49.8 /100 | #175 | Average 85.8% |
| Immigrants | Eastern Africa | 47.7 /100 | #176 | Average 85.7% |
| Immigrants | Uganda | 45.2 /100 | #177 | Average 85.7% |
Demographics Similar to Immigrants from Spain by GED/Equivalency
In terms of ged/equivalency, the demographic groups most similar to Immigrants from Spain are Immigrants from Brazil (86.6%, a difference of 0.0%), Tsimshian (86.6%, a difference of 0.010%), Immigrants from Ukraine (86.7%, a difference of 0.020%), Immigrants from Germany (86.7%, a difference of 0.020%), and Albanian (86.6%, a difference of 0.040%).
| Demographics | Rating | Rank | GED/Equivalency |
| Immigrants | Egypt | 90.4 /100 | #124 | Exceptional 86.7% |
| Celtics | 90.4 /100 | #125 | Exceptional 86.7% |
| Asians | 90.3 /100 | #126 | Exceptional 86.7% |
| Argentineans | 89.7 /100 | #127 | Excellent 86.7% |
| Yugoslavians | 89.5 /100 | #128 | Excellent 86.7% |
| Immigrants | Ukraine | 88.9 /100 | #129 | Excellent 86.7% |
| Immigrants | Germany | 88.8 /100 | #130 | Excellent 86.7% |
| Immigrants | Spain | 88.5 /100 | #131 | Excellent 86.7% |
| Immigrants | Brazil | 88.4 /100 | #132 | Excellent 86.6% |
| Tsimshian | 88.3 /100 | #133 | Excellent 86.6% |
| Albanians | 87.7 /100 | #134 | Excellent 86.6% |
| Immigrants | Asia | 87.4 /100 | #135 | Excellent 86.6% |
| Chileans | 86.9 /100 | #136 | Excellent 86.6% |
| Arabs | 86.7 /100 | #137 | Excellent 86.6% |
| Immigrants | Argentina | 86.5 /100 | #138 | Excellent 86.6% |