Afghan vs Russian GED/Equivalency
COMPARE
Afghan
Russian
GED/Equivalency
GED/Equivalency Comparison
Afghans
Russians
85.9%
GED/EQUIVALENCY
59.7/ 100
METRIC RATING
170th/ 347
METRIC RANK
88.6%
GED/EQUIVALENCY
99.8/ 100
METRIC RATING
23rd/ 347
METRIC RANK
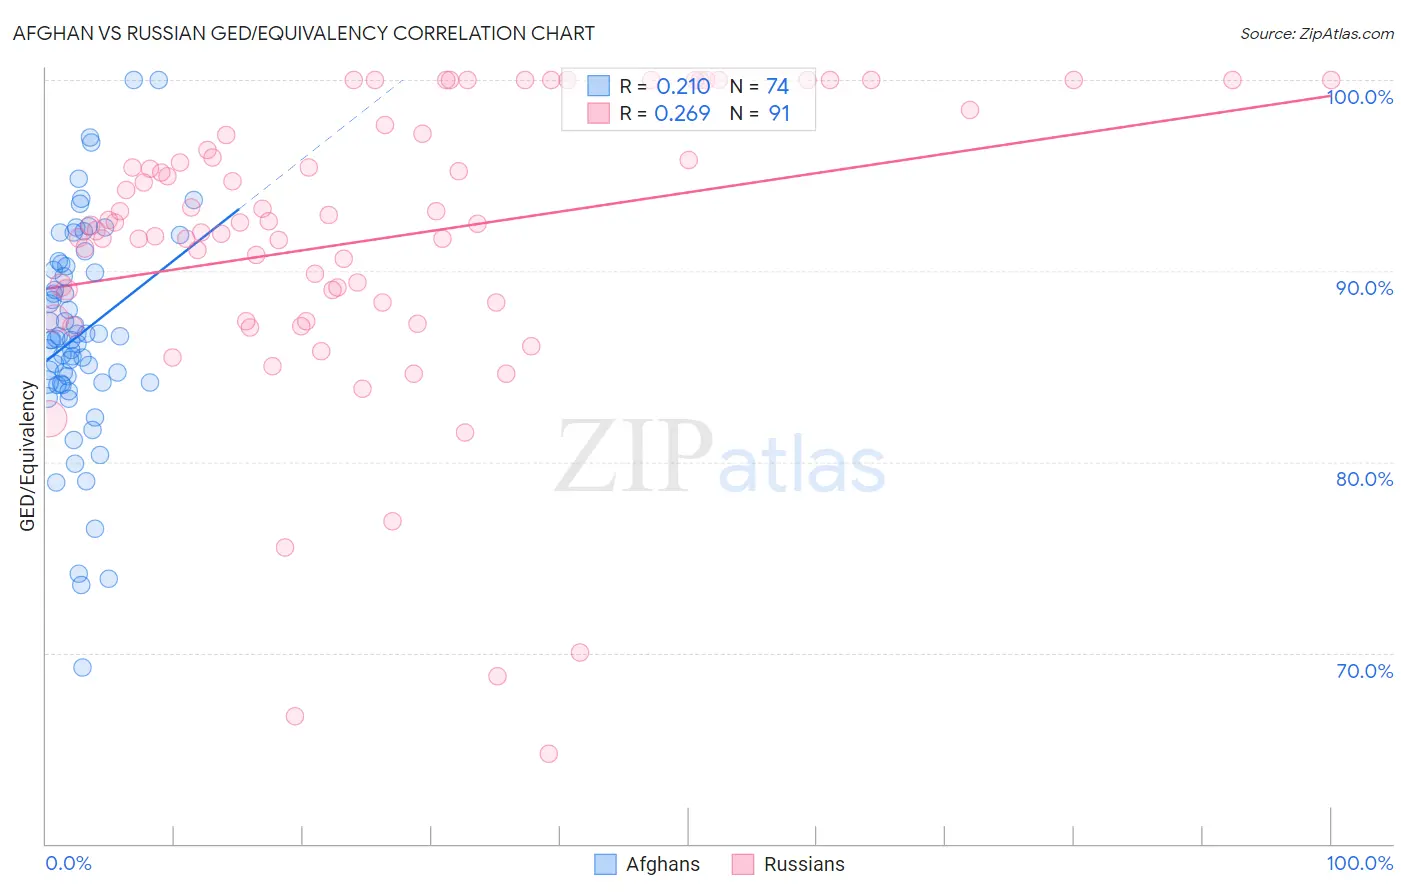
Afghan vs Russian GED/Equivalency Correlation Chart
The statistical analysis conducted on geographies consisting of 148,851,685 people shows a weak positive correlation between the proportion of Afghans and percentage of population with at least ged/equivalency education in the United States with a correlation coefficient (R) of 0.210 and weighted average of 85.9%. Similarly, the statistical analysis conducted on geographies consisting of 512,259,122 people shows a weak positive correlation between the proportion of Russians and percentage of population with at least ged/equivalency education in the United States with a correlation coefficient (R) of 0.269 and weighted average of 88.6%, a difference of 3.1%.
GED/Equivalency Correlation Summary
| Measurement | Afghan | Russian |
| Minimum | 69.2% | 64.7% |
| Maximum | 100.0% | 100.0% |
| Range | 30.8% | 35.3% |
| Mean | 86.7% | 91.6% |
| Median | 86.4% | 92.5% |
| Interquartile 25% (IQ1) | 84.1% | 88.3% |
| Interquartile 75% (IQ3) | 90.3% | 97.1% |
| Interquartile Range (IQR) | 6.1% | 8.8% |
| Standard Deviation (Sample) | 5.7% | 7.6% |
| Standard Deviation (Population) | 5.7% | 7.5% |
Similar Demographics by GED/Equivalency
Demographics Similar to Afghans by GED/Equivalency
In terms of ged/equivalency, the demographic groups most similar to Afghans are Immigrants from Ethiopia (86.0%, a difference of 0.030%), Sierra Leonean (86.0%, a difference of 0.050%), Immigrants from Chile (85.9%, a difference of 0.050%), Ethiopian (86.0%, a difference of 0.090%), and Alsatian (86.0%, a difference of 0.10%).
| Demographics | Rating | Rank | GED/Equivalency |
| Ugandans | 66.3 /100 | #163 | Good 86.1% |
| Venezuelans | 65.5 /100 | #164 | Good 86.0% |
| Alsatians | 64.3 /100 | #165 | Good 86.0% |
| Immigrants | Albania | 64.2 /100 | #166 | Good 86.0% |
| Ethiopians | 63.7 /100 | #167 | Good 86.0% |
| Sierra Leoneans | 61.8 /100 | #168 | Good 86.0% |
| Immigrants | Ethiopia | 61.2 /100 | #169 | Good 86.0% |
| Afghans | 59.7 /100 | #170 | Average 85.9% |
| Immigrants | Chile | 57.3 /100 | #171 | Average 85.9% |
| Bermudans | 55.1 /100 | #172 | Average 85.8% |
| Immigrants | Venezuela | 50.7 /100 | #173 | Average 85.8% |
| Ottawa | 50.0 /100 | #174 | Average 85.8% |
| Immigrants | Bolivia | 49.8 /100 | #175 | Average 85.8% |
| Immigrants | Eastern Africa | 47.7 /100 | #176 | Average 85.7% |
| Immigrants | Uganda | 45.2 /100 | #177 | Average 85.7% |
Demographics Similar to Russians by GED/Equivalency
In terms of ged/equivalency, the demographic groups most similar to Russians are Slovak (88.6%, a difference of 0.0%), Estonian (88.6%, a difference of 0.0%), Immigrants from Australia (88.6%, a difference of 0.010%), Immigrants from Ireland (88.6%, a difference of 0.020%), and Luxembourger (88.6%, a difference of 0.030%).
| Demographics | Rating | Rank | GED/Equivalency |
| Immigrants | Taiwan | 99.9 /100 | #16 | Exceptional 88.8% |
| Croatians | 99.9 /100 | #17 | Exceptional 88.8% |
| Slovenes | 99.9 /100 | #18 | Exceptional 88.8% |
| Swedes | 99.9 /100 | #19 | Exceptional 88.8% |
| Maltese | 99.9 /100 | #20 | Exceptional 88.6% |
| Luxembourgers | 99.8 /100 | #21 | Exceptional 88.6% |
| Immigrants | Ireland | 99.8 /100 | #22 | Exceptional 88.6% |
| Russians | 99.8 /100 | #23 | Exceptional 88.6% |
| Slovaks | 99.8 /100 | #24 | Exceptional 88.6% |
| Estonians | 99.8 /100 | #25 | Exceptional 88.6% |
| Immigrants | Australia | 99.8 /100 | #26 | Exceptional 88.6% |
| Immigrants | Lithuania | 99.8 /100 | #27 | Exceptional 88.6% |
| Immigrants | Northern Europe | 99.8 /100 | #28 | Exceptional 88.5% |
| Poles | 99.8 /100 | #29 | Exceptional 88.5% |
| Turks | 99.8 /100 | #30 | Exceptional 88.5% |