Afghan vs Immigrants from Spain Female Poverty Among 25-34 Year Olds
COMPARE
Afghan
Immigrants from Spain
Female Poverty Among 25-34 Year Olds
Female Poverty Among 25-34 Year Olds Comparison
Afghans
Immigrants from Spain
13.0%
FEMALE POVERTY AMONG 25-34 YEAR OLDS
85.8/ 100
METRIC RATING
134th/ 347
METRIC RANK
12.7%
FEMALE POVERTY AMONG 25-34 YEAR OLDS
95.5/ 100
METRIC RATING
103rd/ 347
METRIC RANK
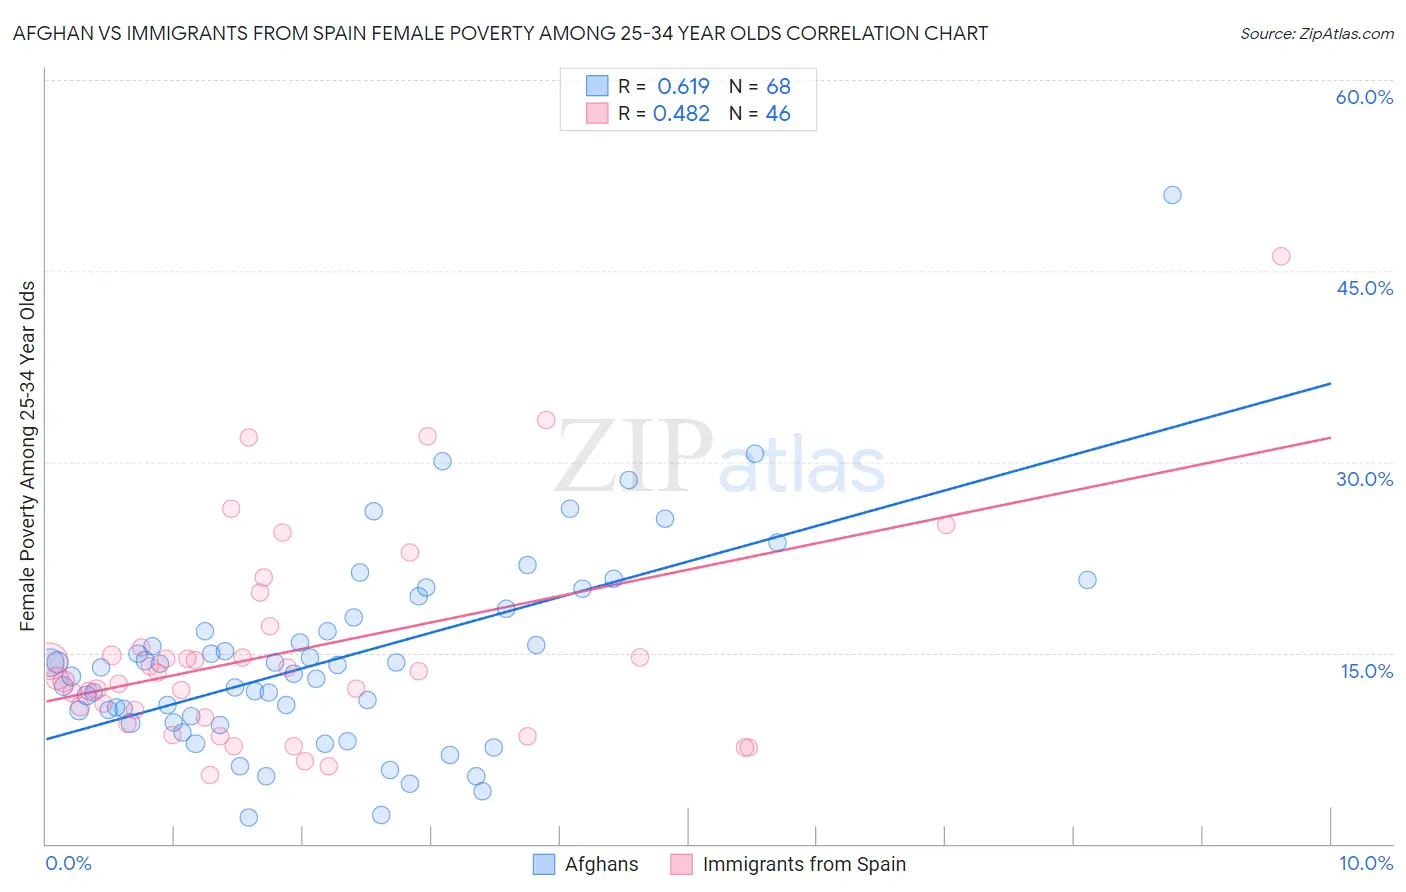
Afghan vs Immigrants from Spain Female Poverty Among 25-34 Year Olds Correlation Chart
The statistical analysis conducted on geographies consisting of 147,945,661 people shows a significant positive correlation between the proportion of Afghans and poverty level among females between the ages 25 and 34 in the United States with a correlation coefficient (R) of 0.619 and weighted average of 13.0%. Similarly, the statistical analysis conducted on geographies consisting of 237,358,886 people shows a moderate positive correlation between the proportion of Immigrants from Spain and poverty level among females between the ages 25 and 34 in the United States with a correlation coefficient (R) of 0.482 and weighted average of 12.7%, a difference of 2.8%.
Female Poverty Among 25-34 Year Olds Correlation Summary
| Measurement | Afghan | Immigrants from Spain |
| Minimum | 2.0% | 5.4% |
| Maximum | 50.9% | 46.2% |
| Range | 48.9% | 40.7% |
| Mean | 14.5% | 15.1% |
| Median | 13.6% | 13.2% |
| Interquartile 25% (IQ1) | 9.8% | 9.9% |
| Interquartile 75% (IQ3) | 17.2% | 15.4% |
| Interquartile Range (IQR) | 7.5% | 5.5% |
| Standard Deviation (Sample) | 7.9% | 8.3% |
| Standard Deviation (Population) | 7.8% | 8.2% |
Similar Demographics by Female Poverty Among 25-34 Year Olds
Demographics Similar to Afghans by Female Poverty Among 25-34 Year Olds
In terms of female poverty among 25-34 year olds, the demographic groups most similar to Afghans are South African (13.0%, a difference of 0.020%), Immigrants from England (13.0%, a difference of 0.040%), Immigrants from Chile (13.1%, a difference of 0.20%), Brazilian (13.1%, a difference of 0.22%), and Austrian (13.1%, a difference of 0.34%).
| Demographics | Rating | Rank | Female Poverty Among 25-34 Year Olds |
| Czechs | 90.3 /100 | #127 | Exceptional 12.9% |
| Syrians | 90.2 /100 | #128 | Exceptional 12.9% |
| Immigrants | North America | 89.7 /100 | #129 | Excellent 12.9% |
| Immigrants | Uzbekistan | 89.6 /100 | #130 | Excellent 12.9% |
| Pakistanis | 88.4 /100 | #131 | Excellent 13.0% |
| Immigrants | Hungary | 88.3 /100 | #132 | Excellent 13.0% |
| Serbians | 87.6 /100 | #133 | Excellent 13.0% |
| Afghans | 85.8 /100 | #134 | Excellent 13.0% |
| South Africans | 85.7 /100 | #135 | Excellent 13.0% |
| Immigrants | England | 85.5 /100 | #136 | Excellent 13.0% |
| Immigrants | Chile | 84.6 /100 | #137 | Excellent 13.1% |
| Brazilians | 84.5 /100 | #138 | Excellent 13.1% |
| Austrians | 83.7 /100 | #139 | Excellent 13.1% |
| Immigrants | Iraq | 83.6 /100 | #140 | Excellent 13.1% |
| New Zealanders | 83.4 /100 | #141 | Excellent 13.1% |
Demographics Similar to Immigrants from Spain by Female Poverty Among 25-34 Year Olds
In terms of female poverty among 25-34 year olds, the demographic groups most similar to Immigrants from Spain are Swedish (12.7%, a difference of 0.050%), Peruvian (12.7%, a difference of 0.060%), Immigrants from South Africa (12.7%, a difference of 0.090%), Immigrants from Switzerland (12.7%, a difference of 0.12%), and Immigrants from Denmark (12.7%, a difference of 0.14%).
| Demographics | Rating | Rank | Female Poverty Among 25-34 Year Olds |
| Immigrants | Zimbabwe | 96.7 /100 | #96 | Exceptional 12.6% |
| Immigrants | Northern Africa | 96.6 /100 | #97 | Exceptional 12.6% |
| Immigrants | Ethiopia | 96.5 /100 | #98 | Exceptional 12.6% |
| Immigrants | Argentina | 96.4 /100 | #99 | Exceptional 12.6% |
| Immigrants | Denmark | 95.7 /100 | #100 | Exceptional 12.7% |
| Immigrants | Switzerland | 95.7 /100 | #101 | Exceptional 12.7% |
| Peruvians | 95.6 /100 | #102 | Exceptional 12.7% |
| Immigrants | Spain | 95.5 /100 | #103 | Exceptional 12.7% |
| Swedes | 95.4 /100 | #104 | Exceptional 12.7% |
| Immigrants | South Africa | 95.3 /100 | #105 | Exceptional 12.7% |
| Tsimshian | 95.1 /100 | #106 | Exceptional 12.7% |
| Poles | 94.9 /100 | #107 | Exceptional 12.7% |
| Immigrants | Norway | 94.4 /100 | #108 | Exceptional 12.7% |
| Immigrants | Peru | 94.3 /100 | #109 | Exceptional 12.7% |
| Australians | 94.1 /100 | #110 | Exceptional 12.8% |