Afghan vs Immigrants from Micronesia Disability Age 35 to 64
COMPARE
Afghan
Immigrants from Micronesia
Disability Age 35 to 64
Disability Age 35 to 64 Comparison
Afghans
Immigrants from Micronesia
10.3%
DISABILITY AGE 35 TO 64
98.9/ 100
METRIC RATING
90th/ 347
METRIC RANK
12.9%
DISABILITY AGE 35 TO 64
0.1/ 100
METRIC RATING
279th/ 347
METRIC RANK
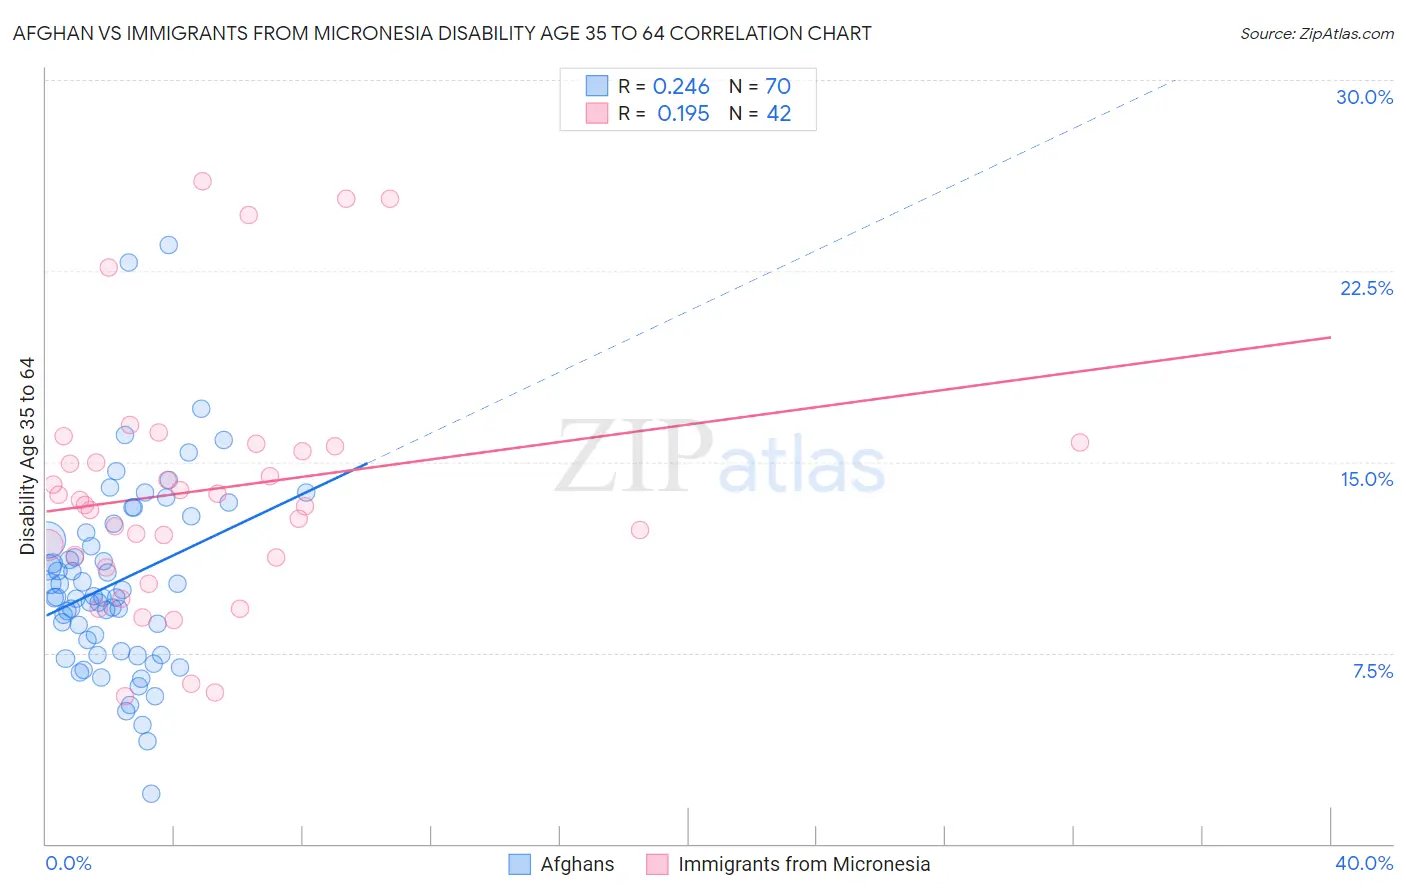
Afghan vs Immigrants from Micronesia Disability Age 35 to 64 Correlation Chart
The statistical analysis conducted on geographies consisting of 148,816,709 people shows a weak positive correlation between the proportion of Afghans and percentage of population with a disability between the ages 34 and 64 in the United States with a correlation coefficient (R) of 0.246 and weighted average of 10.3%. Similarly, the statistical analysis conducted on geographies consisting of 61,599,230 people shows a poor positive correlation between the proportion of Immigrants from Micronesia and percentage of population with a disability between the ages 34 and 64 in the United States with a correlation coefficient (R) of 0.195 and weighted average of 12.9%, a difference of 26.0%.
Disability Age 35 to 64 Correlation Summary
| Measurement | Afghan | Immigrants from Micronesia |
| Minimum | 2.0% | 5.8% |
| Maximum | 23.5% | 26.0% |
| Range | 21.5% | 20.3% |
| Mean | 10.3% | 13.9% |
| Median | 9.7% | 13.4% |
| Interquartile 25% (IQ1) | 7.5% | 11.3% |
| Interquartile 75% (IQ3) | 12.2% | 15.6% |
| Interquartile Range (IQR) | 4.7% | 4.4% |
| Standard Deviation (Sample) | 3.8% | 4.9% |
| Standard Deviation (Population) | 3.7% | 4.8% |
Similar Demographics by Disability Age 35 to 64
Demographics Similar to Afghans by Disability Age 35 to 64
In terms of disability age 35 to 64, the demographic groups most similar to Afghans are Immigrants from Lebanon (10.3%, a difference of 0.010%), Uruguayan (10.2%, a difference of 0.11%), Chilean (10.2%, a difference of 0.12%), Immigrants from Northern Africa (10.3%, a difference of 0.33%), and Immigrants from Europe (10.2%, a difference of 0.36%).
| Demographics | Rating | Rank | Disability Age 35 to 64 |
| Immigrants | Brazil | 99.2 /100 | #83 | Exceptional 10.2% |
| Sri Lankans | 99.2 /100 | #84 | Exceptional 10.2% |
| Immigrants | Kuwait | 99.1 /100 | #85 | Exceptional 10.2% |
| Immigrants | Europe | 99.1 /100 | #86 | Exceptional 10.2% |
| Nicaraguans | 99.1 /100 | #87 | Exceptional 10.2% |
| Chileans | 99.0 /100 | #88 | Exceptional 10.2% |
| Uruguayans | 99.0 /100 | #89 | Exceptional 10.2% |
| Afghans | 98.9 /100 | #90 | Exceptional 10.3% |
| Immigrants | Lebanon | 98.9 /100 | #91 | Exceptional 10.3% |
| Immigrants | Northern Africa | 98.7 /100 | #92 | Exceptional 10.3% |
| Immigrants | North Macedonia | 98.7 /100 | #93 | Exceptional 10.3% |
| Immigrants | Italy | 98.7 /100 | #94 | Exceptional 10.3% |
| Chinese | 98.7 /100 | #95 | Exceptional 10.3% |
| Immigrants | South Africa | 98.5 /100 | #96 | Exceptional 10.3% |
| Immigrants | Denmark | 98.4 /100 | #97 | Exceptional 10.3% |
Demographics Similar to Immigrants from Micronesia by Disability Age 35 to 64
In terms of disability age 35 to 64, the demographic groups most similar to Immigrants from Micronesia are French Canadian (12.9%, a difference of 0.020%), Immigrants from Dominican Republic (12.9%, a difference of 0.050%), Liberian (12.9%, a difference of 0.17%), Somali (12.9%, a difference of 0.25%), and Scotch-Irish (13.0%, a difference of 0.36%).
| Demographics | Rating | Rank | Disability Age 35 to 64 |
| U.S. Virgin Islanders | 0.1 /100 | #272 | Tragic 12.8% |
| Pennsylvania Germans | 0.1 /100 | #273 | Tragic 12.8% |
| Celtics | 0.1 /100 | #274 | Tragic 12.9% |
| Dominicans | 0.1 /100 | #275 | Tragic 12.9% |
| Somalis | 0.1 /100 | #276 | Tragic 12.9% |
| Immigrants | Dominican Republic | 0.1 /100 | #277 | Tragic 12.9% |
| French Canadians | 0.1 /100 | #278 | Tragic 12.9% |
| Immigrants | Micronesia | 0.1 /100 | #279 | Tragic 12.9% |
| Liberians | 0.1 /100 | #280 | Tragic 12.9% |
| Scotch-Irish | 0.1 /100 | #281 | Tragic 13.0% |
| Immigrants | Laos | 0.1 /100 | #282 | Tragic 13.0% |
| Central American Indians | 0.0 /100 | #283 | Tragic 13.0% |
| Immigrants | Nonimmigrants | 0.0 /100 | #284 | Tragic 13.0% |
| Immigrants | Somalia | 0.0 /100 | #285 | Tragic 13.1% |
| Hmong | 0.0 /100 | #286 | Tragic 13.1% |