Afghan vs Immigrants from Japan 5th Grade
COMPARE
Afghan
Immigrants from Japan
5th Grade
5th Grade Comparison
Afghans
Immigrants from Japan
96.7%
5TH GRADE
0.2/ 100
METRIC RATING
270th/ 347
METRIC RANK
97.6%
5TH GRADE
94.7/ 100
METRIC RATING
122nd/ 347
METRIC RANK
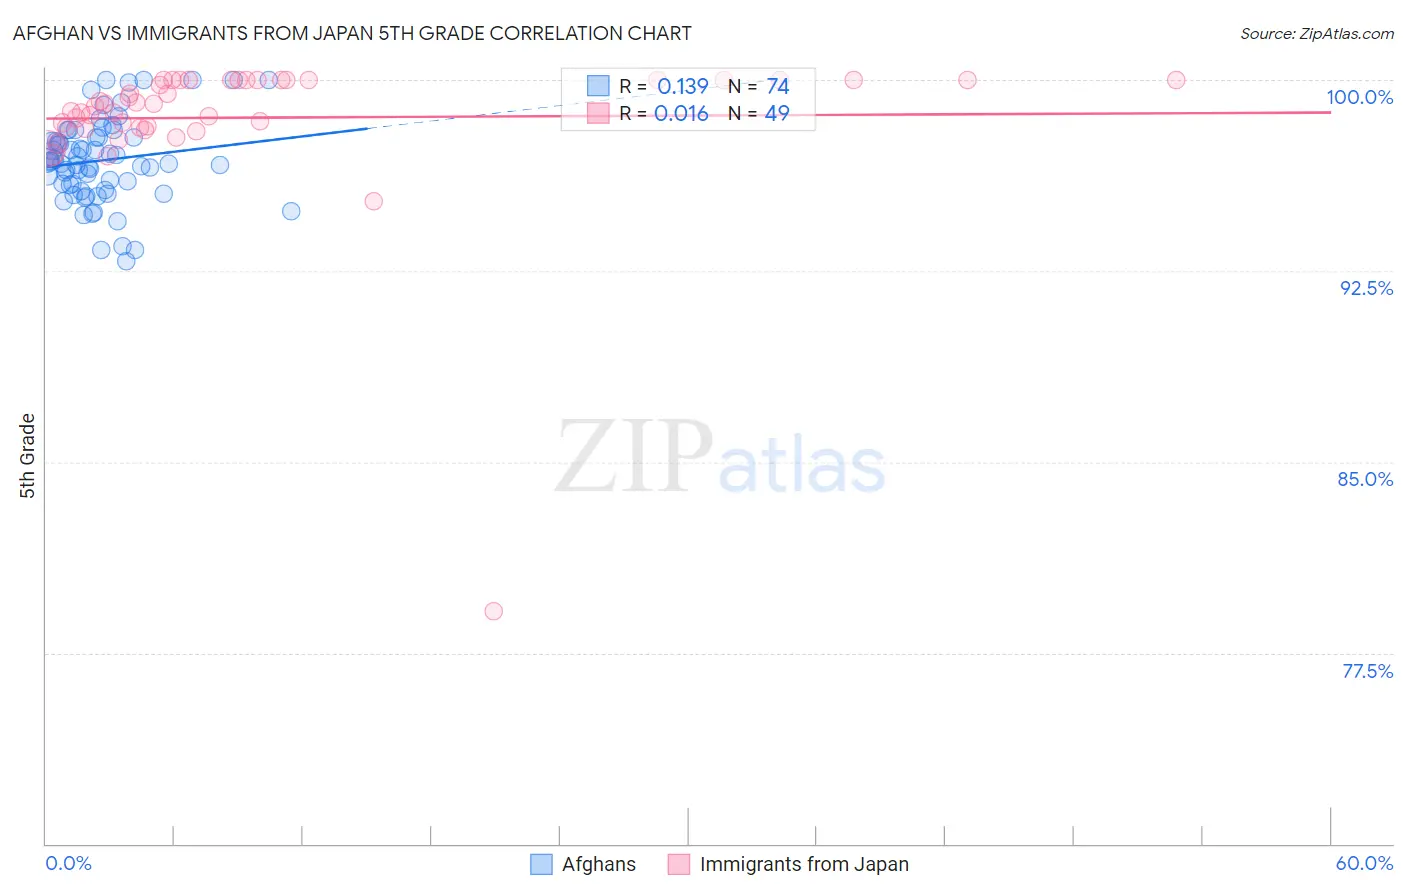
Afghan vs Immigrants from Japan 5th Grade Correlation Chart
The statistical analysis conducted on geographies consisting of 148,851,685 people shows a poor positive correlation between the proportion of Afghans and percentage of population with at least 5th grade education in the United States with a correlation coefficient (R) of 0.139 and weighted average of 96.7%. Similarly, the statistical analysis conducted on geographies consisting of 340,148,942 people shows no correlation between the proportion of Immigrants from Japan and percentage of population with at least 5th grade education in the United States with a correlation coefficient (R) of 0.016 and weighted average of 97.6%, a difference of 0.98%.
5th Grade Correlation Summary
| Measurement | Afghan | Immigrants from Japan |
| Minimum | 92.9% | 79.1% |
| Maximum | 100.0% | 100.0% |
| Range | 7.1% | 20.9% |
| Mean | 96.8% | 98.5% |
| Median | 96.8% | 99.0% |
| Interquartile 25% (IQ1) | 95.9% | 98.2% |
| Interquartile 75% (IQ3) | 97.7% | 100.0% |
| Interquartile Range (IQR) | 1.9% | 1.8% |
| Standard Deviation (Sample) | 1.6% | 3.0% |
| Standard Deviation (Population) | 1.6% | 3.0% |
Similar Demographics by 5th Grade
Demographics Similar to Afghans by 5th Grade
In terms of 5th grade, the demographic groups most similar to Afghans are Immigrants from Hong Kong (96.7%, a difference of 0.0%), Trinidadian and Tobagonian (96.7%, a difference of 0.020%), Yaqui (96.7%, a difference of 0.020%), Immigrants from Cameroon (96.7%, a difference of 0.020%), and Immigrants from Peru (96.6%, a difference of 0.030%).
| Demographics | Rating | Rank | 5th Grade |
| Immigrants | Uzbekistan | 0.3 /100 | #263 | Tragic 96.8% |
| West Indians | 0.3 /100 | #264 | Tragic 96.8% |
| Taiwanese | 0.3 /100 | #265 | Tragic 96.7% |
| Immigrants | Nigeria | 0.3 /100 | #266 | Tragic 96.7% |
| Immigrants | South America | 0.3 /100 | #267 | Tragic 96.7% |
| Armenians | 0.3 /100 | #268 | Tragic 96.7% |
| Ghanaians | 0.2 /100 | #269 | Tragic 96.7% |
| Afghans | 0.2 /100 | #270 | Tragic 96.7% |
| Immigrants | Hong Kong | 0.2 /100 | #271 | Tragic 96.7% |
| Trinidadians and Tobagonians | 0.1 /100 | #272 | Tragic 96.7% |
| Yaqui | 0.1 /100 | #273 | Tragic 96.7% |
| Immigrants | Cameroon | 0.1 /100 | #274 | Tragic 96.7% |
| Immigrants | Peru | 0.1 /100 | #275 | Tragic 96.6% |
| Cubans | 0.1 /100 | #276 | Tragic 96.6% |
| Immigrants | Bolivia | 0.1 /100 | #277 | Tragic 96.6% |
Demographics Similar to Immigrants from Japan by 5th Grade
In terms of 5th grade, the demographic groups most similar to Immigrants from Japan are Immigrants from Zimbabwe (97.6%, a difference of 0.0%), Immigrants from France (97.6%, a difference of 0.0%), Immigrants from Norway (97.6%, a difference of 0.0%), Basque (97.6%, a difference of 0.010%), and Syrian (97.6%, a difference of 0.010%).
| Demographics | Rating | Rank | 5th Grade |
| Okinawans | 95.7 /100 | #115 | Exceptional 97.6% |
| Immigrants | Croatia | 95.5 /100 | #116 | Exceptional 97.6% |
| Immigrants | Saudi Arabia | 95.4 /100 | #117 | Exceptional 97.6% |
| Basques | 95.2 /100 | #118 | Exceptional 97.6% |
| Syrians | 95.1 /100 | #119 | Exceptional 97.6% |
| Immigrants | Zimbabwe | 94.9 /100 | #120 | Exceptional 97.6% |
| Immigrants | France | 94.8 /100 | #121 | Exceptional 97.6% |
| Immigrants | Japan | 94.7 /100 | #122 | Exceptional 97.6% |
| Immigrants | Norway | 94.6 /100 | #123 | Exceptional 97.6% |
| Spanish | 93.7 /100 | #124 | Exceptional 97.6% |
| Immigrants | Bulgaria | 93.1 /100 | #125 | Exceptional 97.6% |
| Hmong | 92.3 /100 | #126 | Exceptional 97.6% |
| Immigrants | Serbia | 92.3 /100 | #127 | Exceptional 97.6% |
| Colville | 92.0 /100 | #128 | Exceptional 97.6% |
| Immigrants | Europe | 91.9 /100 | #129 | Exceptional 97.6% |