Chinese vs Immigrants from Armenia Disability Age Over 75
COMPARE
Chinese
Immigrants from Armenia
Disability Age Over 75
Disability Age Over 75 Comparison
Chinese
Immigrants from Armenia
48.7%
DISABILITY AGE OVER 75
0.5/ 100
METRIC RATING
255th/ 347
METRIC RANK
54.3%
DISABILITY AGE OVER 75
0.0/ 100
METRIC RATING
336th/ 347
METRIC RANK
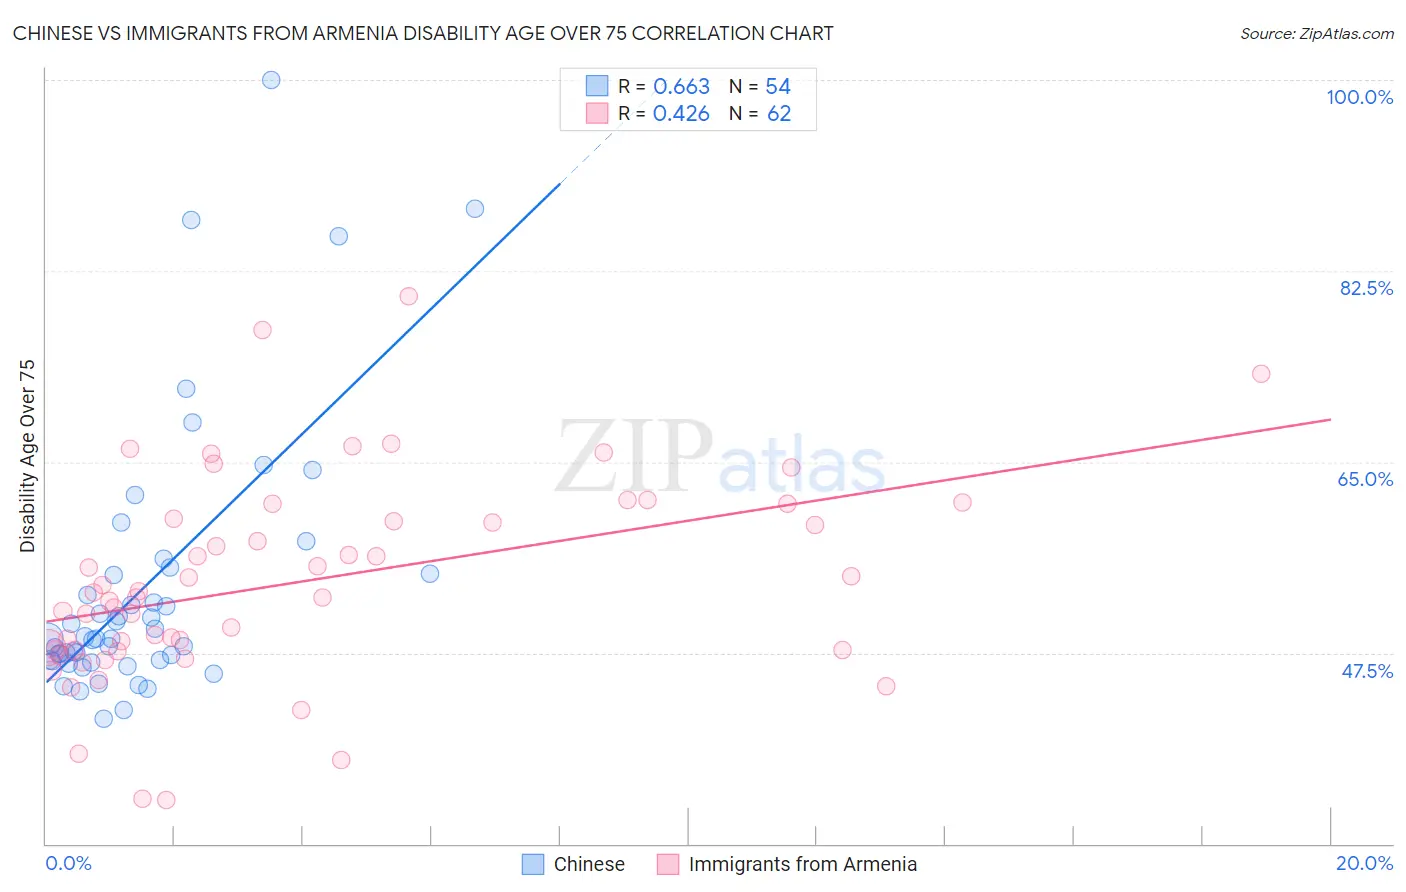
Chinese vs Immigrants from Armenia Disability Age Over 75 Correlation Chart
The statistical analysis conducted on geographies consisting of 64,754,730 people shows a significant positive correlation between the proportion of Chinese and percentage of population with a disability over the age of 75 in the United States with a correlation coefficient (R) of 0.663 and weighted average of 48.7%. Similarly, the statistical analysis conducted on geographies consisting of 97,687,022 people shows a moderate positive correlation between the proportion of Immigrants from Armenia and percentage of population with a disability over the age of 75 in the United States with a correlation coefficient (R) of 0.426 and weighted average of 54.3%, a difference of 11.5%.
Disability Age Over 75 Correlation Summary
| Measurement | Chinese | Immigrants from Armenia |
| Minimum | 41.4% | 34.0% |
| Maximum | 100.0% | 80.2% |
| Range | 58.6% | 46.2% |
| Mean | 53.5% | 54.0% |
| Median | 48.8% | 52.8% |
| Interquartile 25% (IQ1) | 46.8% | 47.7% |
| Interquartile 75% (IQ3) | 54.8% | 59.8% |
| Interquartile Range (IQR) | 8.0% | 12.1% |
| Standard Deviation (Sample) | 12.3% | 9.4% |
| Standard Deviation (Population) | 12.2% | 9.3% |
Similar Demographics by Disability Age Over 75
Demographics Similar to Chinese by Disability Age Over 75
In terms of disability age over 75, the demographic groups most similar to Chinese are Immigrants from Congo (48.7%, a difference of 0.010%), Immigrants from Vietnam (48.7%, a difference of 0.040%), Blackfeet (48.8%, a difference of 0.060%), British West Indian (48.7%, a difference of 0.070%), and Immigrants from Philippines (48.8%, a difference of 0.10%).
| Demographics | Rating | Rank | Disability Age Over 75 |
| Sri Lankans | 1.4 /100 | #248 | Tragic 48.5% |
| Iraqis | 1.0 /100 | #249 | Tragic 48.6% |
| West Indians | 0.8 /100 | #250 | Tragic 48.6% |
| Koreans | 0.8 /100 | #251 | Tragic 48.6% |
| Immigrants | South Eastern Asia | 0.7 /100 | #252 | Tragic 48.7% |
| British West Indians | 0.6 /100 | #253 | Tragic 48.7% |
| Immigrants | Vietnam | 0.6 /100 | #254 | Tragic 48.7% |
| Chinese | 0.5 /100 | #255 | Tragic 48.7% |
| Immigrants | Congo | 0.5 /100 | #256 | Tragic 48.7% |
| Blackfeet | 0.5 /100 | #257 | Tragic 48.8% |
| Immigrants | Philippines | 0.4 /100 | #258 | Tragic 48.8% |
| Central Americans | 0.4 /100 | #259 | Tragic 48.8% |
| Immigrants | Afghanistan | 0.4 /100 | #260 | Tragic 48.8% |
| Africans | 0.3 /100 | #261 | Tragic 48.9% |
| Immigrants | West Indies | 0.3 /100 | #262 | Tragic 48.9% |
Demographics Similar to Immigrants from Armenia by Disability Age Over 75
In terms of disability age over 75, the demographic groups most similar to Immigrants from Armenia are Yuman (54.4%, a difference of 0.16%), Kiowa (54.2%, a difference of 0.17%), Alaskan Athabascan (54.0%, a difference of 0.69%), Apache (53.6%, a difference of 1.4%), and Colville (55.4%, a difference of 1.9%).
| Demographics | Rating | Rank | Disability Age Over 75 |
| Alaska Natives | 0.0 /100 | #329 | Tragic 52.8% |
| Puerto Ricans | 0.0 /100 | #330 | Tragic 52.9% |
| Hopi | 0.0 /100 | #331 | Tragic 52.9% |
| Natives/Alaskans | 0.0 /100 | #332 | Tragic 53.1% |
| Apache | 0.0 /100 | #333 | Tragic 53.6% |
| Alaskan Athabascans | 0.0 /100 | #334 | Tragic 54.0% |
| Kiowa | 0.0 /100 | #335 | Tragic 54.2% |
| Immigrants | Armenia | 0.0 /100 | #336 | Tragic 54.3% |
| Yuman | 0.0 /100 | #337 | Tragic 54.4% |
| Colville | 0.0 /100 | #338 | Tragic 55.4% |
| Pima | 0.0 /100 | #339 | Tragic 55.8% |
| Pueblo | 0.0 /100 | #340 | Tragic 55.9% |
| Houma | 0.0 /100 | #341 | Tragic 56.2% |
| Lumbee | 0.0 /100 | #342 | Tragic 56.2% |
| Tohono O'odham | 0.0 /100 | #343 | Tragic 56.7% |