Immigrants from Micronesia vs German Russian Disability Age 35 to 64
COMPARE
Immigrants from Micronesia
German Russian
Disability Age 35 to 64
Disability Age 35 to 64 Comparison
Immigrants from Micronesia
German Russians
12.9%
DISABILITY AGE 35 TO 64
0.1/ 100
METRIC RATING
279th/ 347
METRIC RANK
12.5%
DISABILITY AGE 35 TO 64
0.5/ 100
METRIC RATING
260th/ 347
METRIC RANK
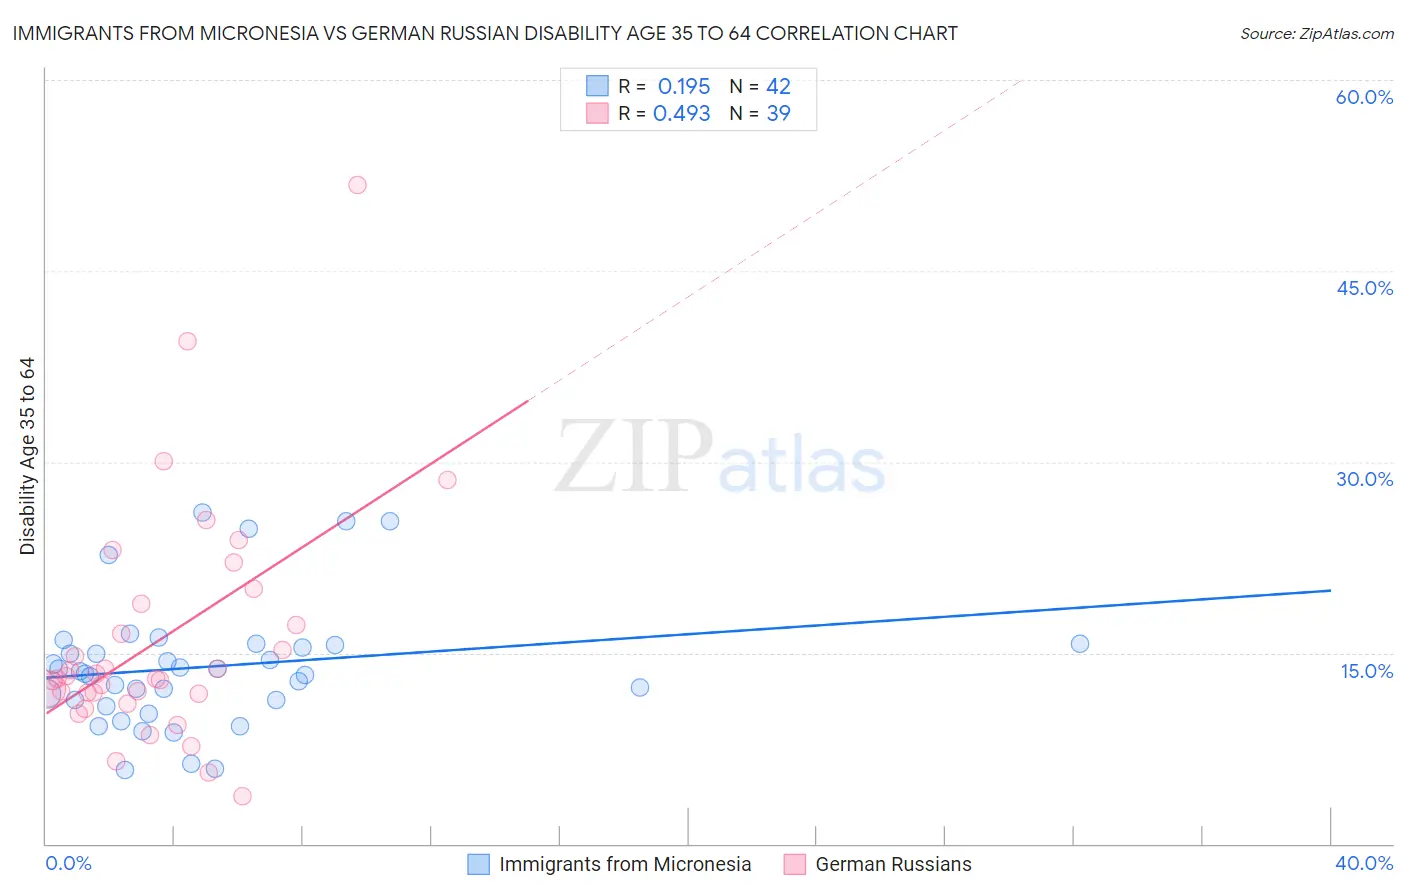
Immigrants from Micronesia vs German Russian Disability Age 35 to 64 Correlation Chart
The statistical analysis conducted on geographies consisting of 61,599,230 people shows a poor positive correlation between the proportion of Immigrants from Micronesia and percentage of population with a disability between the ages 34 and 64 in the United States with a correlation coefficient (R) of 0.195 and weighted average of 12.9%. Similarly, the statistical analysis conducted on geographies consisting of 96,440,247 people shows a moderate positive correlation between the proportion of German Russians and percentage of population with a disability between the ages 34 and 64 in the United States with a correlation coefficient (R) of 0.493 and weighted average of 12.5%, a difference of 3.7%.
Disability Age 35 to 64 Correlation Summary
| Measurement | Immigrants from Micronesia | German Russian |
| Minimum | 5.8% | 3.7% |
| Maximum | 26.0% | 51.7% |
| Range | 20.3% | 48.0% |
| Mean | 13.9% | 16.0% |
| Median | 13.4% | 13.0% |
| Interquartile 25% (IQ1) | 11.3% | 11.8% |
| Interquartile 75% (IQ3) | 15.6% | 18.8% |
| Interquartile Range (IQR) | 4.4% | 7.1% |
| Standard Deviation (Sample) | 4.9% | 9.2% |
| Standard Deviation (Population) | 4.8% | 9.1% |
Demographics Similar to Immigrants from Micronesia and German Russians by Disability Age 35 to 64
In terms of disability age 35 to 64, the demographic groups most similar to Immigrants from Micronesia are French Canadian (12.9%, a difference of 0.020%), Immigrants from Dominican Republic (12.9%, a difference of 0.050%), Somali (12.9%, a difference of 0.25%), Dominican (12.9%, a difference of 0.37%), and Celtic (12.9%, a difference of 0.51%). Similarly, the demographic groups most similar to German Russians are Malaysian (12.5%, a difference of 0.15%), Senegalese (12.5%, a difference of 0.23%), English (12.4%, a difference of 0.25%), Immigrants from Zaire (12.5%, a difference of 0.48%), and Immigrants from Portugal (12.5%, a difference of 0.49%).
| Demographics | Rating | Rank | Disability Age 35 to 64 |
| English | 0.6 /100 | #259 | Tragic 12.4% |
| German Russians | 0.5 /100 | #260 | Tragic 12.5% |
| Malaysians | 0.5 /100 | #261 | Tragic 12.5% |
| Senegalese | 0.5 /100 | #262 | Tragic 12.5% |
| Immigrants | Zaire | 0.4 /100 | #263 | Tragic 12.5% |
| Immigrants | Portugal | 0.4 /100 | #264 | Tragic 12.5% |
| Marshallese | 0.4 /100 | #265 | Tragic 12.5% |
| Whites/Caucasians | 0.3 /100 | #266 | Tragic 12.6% |
| Sub-Saharan Africans | 0.2 /100 | #267 | Tragic 12.6% |
| Immigrants | Dominica | 0.2 /100 | #268 | Tragic 12.7% |
| Spanish | 0.2 /100 | #269 | Tragic 12.7% |
| French | 0.2 /100 | #270 | Tragic 12.7% |
| Nepalese | 0.1 /100 | #271 | Tragic 12.8% |
| U.S. Virgin Islanders | 0.1 /100 | #272 | Tragic 12.8% |
| Pennsylvania Germans | 0.1 /100 | #273 | Tragic 12.8% |
| Celtics | 0.1 /100 | #274 | Tragic 12.9% |
| Dominicans | 0.1 /100 | #275 | Tragic 12.9% |
| Somalis | 0.1 /100 | #276 | Tragic 12.9% |
| Immigrants | Dominican Republic | 0.1 /100 | #277 | Tragic 12.9% |
| French Canadians | 0.1 /100 | #278 | Tragic 12.9% |
| Immigrants | Micronesia | 0.1 /100 | #279 | Tragic 12.9% |