Yuman vs Immigrants from Yemen High School Diploma
COMPARE
Yuman
Immigrants from Yemen
High School Diploma
High School Diploma Comparison
Yuman
Immigrants from Yemen
84.0%
HIGH SCHOOL DIPLOMA
0.0/ 100
METRIC RATING
321st/ 347
METRIC RANK
81.8%
HIGH SCHOOL DIPLOMA
0.0/ 100
METRIC RATING
337th/ 347
METRIC RANK
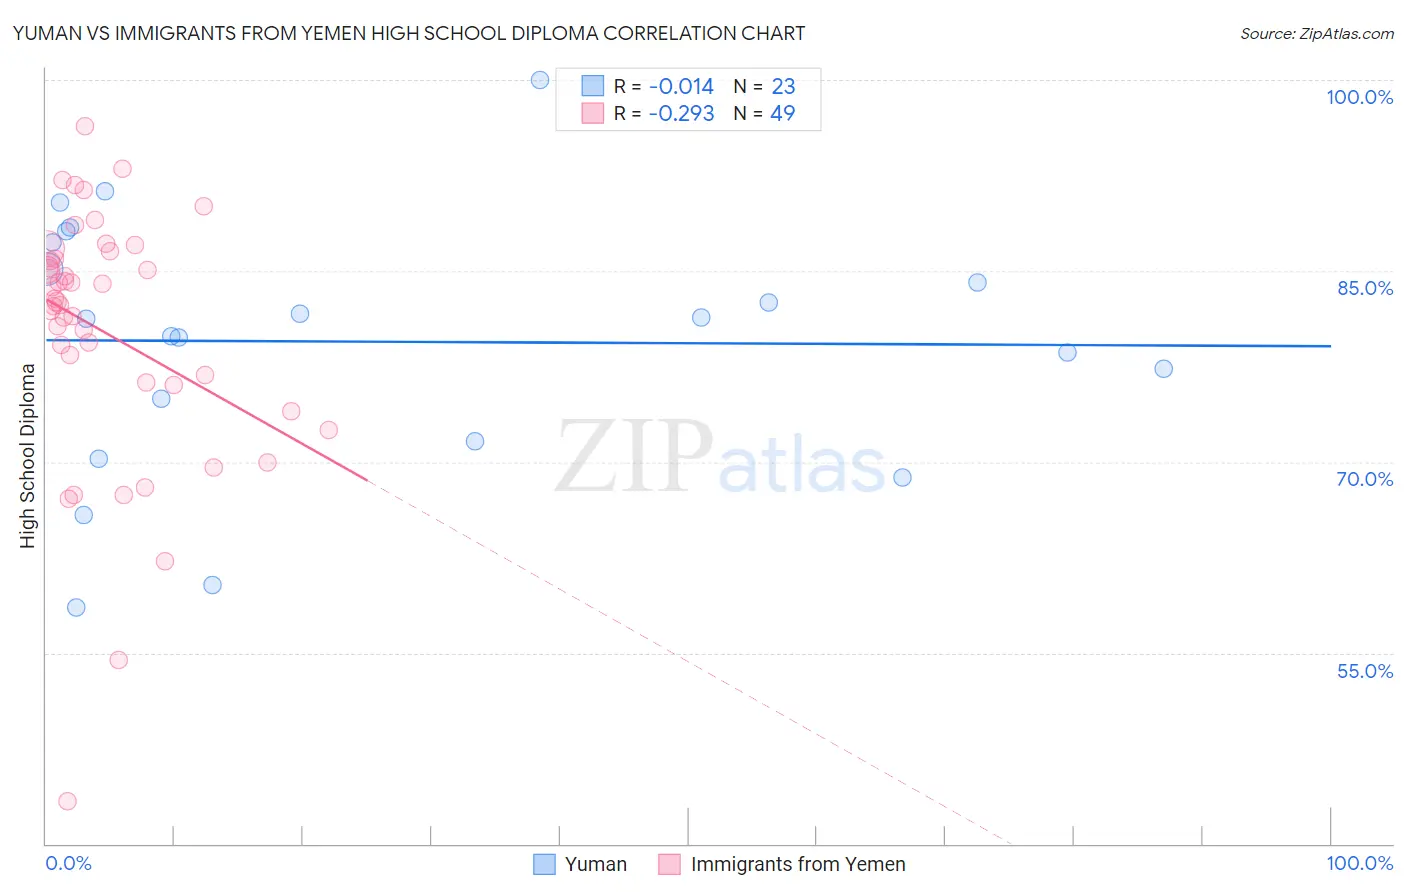
Yuman vs Immigrants from Yemen High School Diploma Correlation Chart
The statistical analysis conducted on geographies consisting of 40,696,349 people shows no correlation between the proportion of Yuman and percentage of population with at least high school diploma education in the United States with a correlation coefficient (R) of -0.014 and weighted average of 84.0%. Similarly, the statistical analysis conducted on geographies consisting of 82,429,885 people shows a weak negative correlation between the proportion of Immigrants from Yemen and percentage of population with at least high school diploma education in the United States with a correlation coefficient (R) of -0.293 and weighted average of 81.8%, a difference of 2.6%.
High School Diploma Correlation Summary
| Measurement | Yuman | Immigrants from Yemen |
| Minimum | 58.6% | 43.3% |
| Maximum | 100.0% | 96.4% |
| Range | 41.4% | 53.1% |
| Mean | 79.4% | 80.2% |
| Median | 81.2% | 82.6% |
| Interquartile 25% (IQ1) | 71.6% | 76.1% |
| Interquartile 75% (IQ3) | 87.2% | 86.2% |
| Interquartile Range (IQR) | 15.6% | 10.1% |
| Standard Deviation (Sample) | 10.1% | 10.1% |
| Standard Deviation (Population) | 9.9% | 10.0% |
Demographics Similar to Yuman and Immigrants from Yemen by High School Diploma
In terms of high school diploma, the demographic groups most similar to Yuman are Nicaraguan (84.1%, a difference of 0.14%), Central American Indian (84.2%, a difference of 0.24%), Lumbee (83.6%, a difference of 0.41%), Immigrants from Cuba (83.5%, a difference of 0.57%), and Immigrants from Cabo Verde (83.3%, a difference of 0.86%). Similarly, the demographic groups most similar to Immigrants from Yemen are Guatemalan (82.0%, a difference of 0.15%), Immigrants from Dominican Republic (82.0%, a difference of 0.15%), Salvadoran (81.7%, a difference of 0.17%), Tohono O'odham (82.1%, a difference of 0.27%), and Pima (81.6%, a difference of 0.27%).
| Demographics | Rating | Rank | High School Diploma |
| Central American Indians | 0.0 /100 | #319 | Tragic 84.2% |
| Nicaraguans | 0.0 /100 | #320 | Tragic 84.1% |
| Yuman | 0.0 /100 | #321 | Tragic 84.0% |
| Lumbee | 0.0 /100 | #322 | Tragic 83.6% |
| Immigrants | Cuba | 0.0 /100 | #323 | Tragic 83.5% |
| Immigrants | Cabo Verde | 0.0 /100 | #324 | Tragic 83.3% |
| Immigrants | Nicaragua | 0.0 /100 | #325 | Tragic 83.1% |
| Mexican American Indians | 0.0 /100 | #326 | Tragic 83.0% |
| Hondurans | 0.0 /100 | #327 | Tragic 83.0% |
| Dominicans | 0.0 /100 | #328 | Tragic 82.9% |
| Hispanics or Latinos | 0.0 /100 | #329 | Tragic 82.9% |
| Immigrants | Azores | 0.0 /100 | #330 | Tragic 82.8% |
| Central Americans | 0.0 /100 | #331 | Tragic 82.5% |
| Immigrants | Honduras | 0.0 /100 | #332 | Tragic 82.5% |
| Immigrants | Latin America | 0.0 /100 | #333 | Tragic 82.1% |
| Tohono O'odham | 0.0 /100 | #334 | Tragic 82.1% |
| Guatemalans | 0.0 /100 | #335 | Tragic 82.0% |
| Immigrants | Dominican Republic | 0.0 /100 | #336 | Tragic 82.0% |
| Immigrants | Yemen | 0.0 /100 | #337 | Tragic 81.8% |
| Salvadorans | 0.0 /100 | #338 | Tragic 81.7% |
| Pima | 0.0 /100 | #339 | Tragic 81.6% |