French American Indian vs Cheyenne Vision Disability
COMPARE
French American Indian
Cheyenne
Vision Disability
Vision Disability Comparison
French American Indians
Cheyenne
2.5%
VISION DISABILITY
0.0/ 100
METRIC RATING
288th/ 347
METRIC RANK
3.1%
VISION DISABILITY
0.0/ 100
METRIC RATING
334th/ 347
METRIC RANK
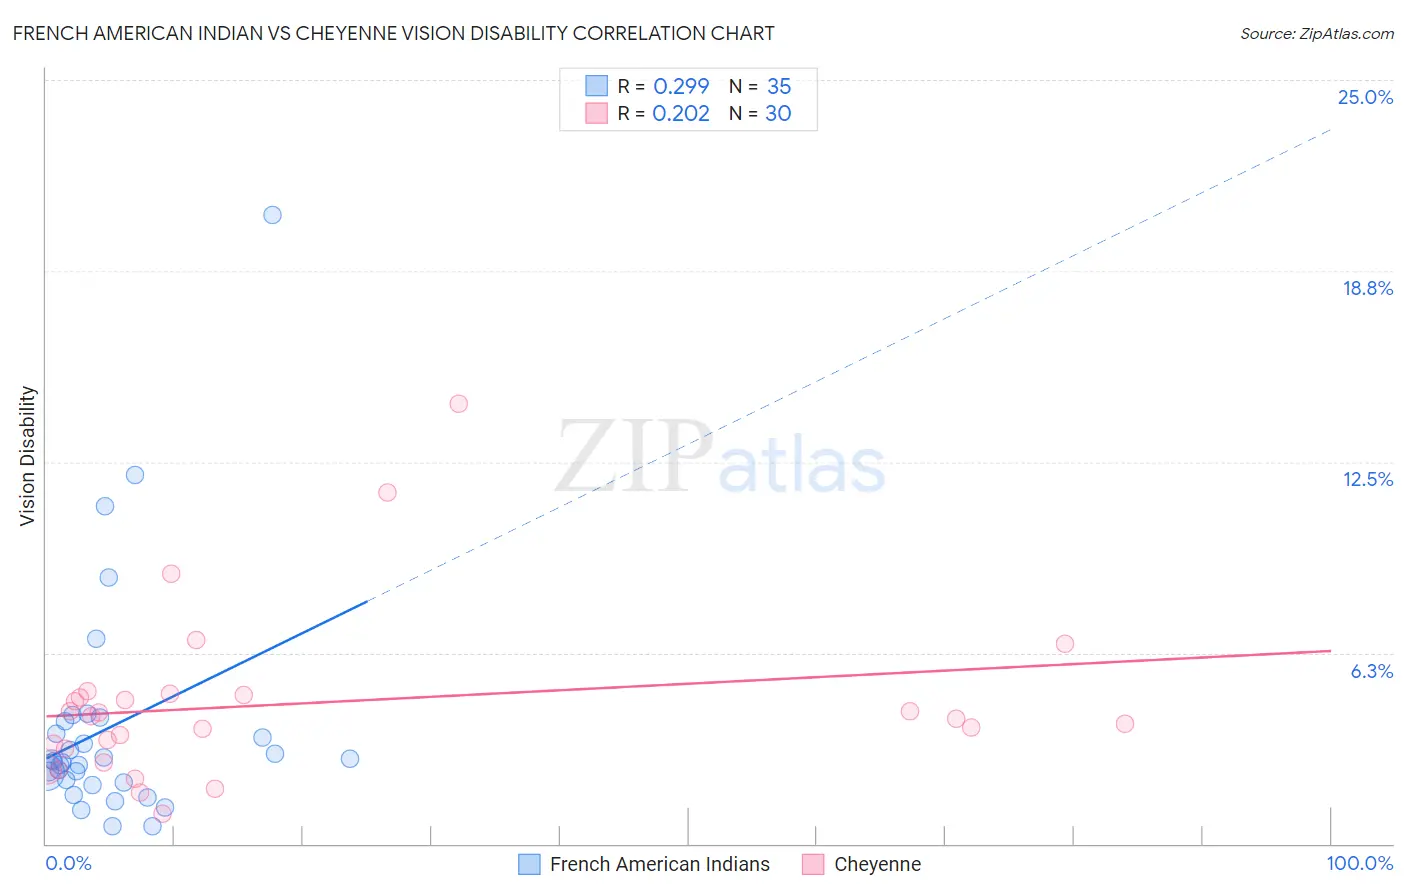
French American Indian vs Cheyenne Vision Disability Correlation Chart
The statistical analysis conducted on geographies consisting of 131,938,190 people shows a weak positive correlation between the proportion of French American Indians and percentage of population with vision disability in the United States with a correlation coefficient (R) of 0.299 and weighted average of 2.5%. Similarly, the statistical analysis conducted on geographies consisting of 80,705,474 people shows a weak positive correlation between the proportion of Cheyenne and percentage of population with vision disability in the United States with a correlation coefficient (R) of 0.202 and weighted average of 3.1%, a difference of 25.3%.
Vision Disability Correlation Summary
| Measurement | French American Indian | Cheyenne |
| Minimum | 0.57% | 1.0% |
| Maximum | 20.6% | 14.4% |
| Range | 20.0% | 13.4% |
| Mean | 3.8% | 4.6% |
| Median | 2.7% | 4.1% |
| Interquartile 25% (IQ1) | 2.0% | 3.1% |
| Interquartile 75% (IQ3) | 4.0% | 4.9% |
| Interquartile Range (IQR) | 2.0% | 1.7% |
| Standard Deviation (Sample) | 3.9% | 2.8% |
| Standard Deviation (Population) | 3.8% | 2.8% |
Similar Demographics by Vision Disability
Demographics Similar to French American Indians by Vision Disability
In terms of vision disability, the demographic groups most similar to French American Indians are Honduran (2.5%, a difference of 0.020%), Sioux (2.5%, a difference of 0.17%), Immigrants from Central America (2.5%, a difference of 0.18%), Yakama (2.5%, a difference of 0.19%), and Nonimmigrants (2.5%, a difference of 0.41%).
| Demographics | Rating | Rank | Vision Disability |
| U.S. Virgin Islanders | 0.0 /100 | #281 | Tragic 2.5% |
| Immigrants | Caribbean | 0.0 /100 | #282 | Tragic 2.5% |
| Puget Sound Salish | 0.0 /100 | #283 | Tragic 2.5% |
| Yakama | 0.0 /100 | #284 | Tragic 2.5% |
| Immigrants | Central America | 0.0 /100 | #285 | Tragic 2.5% |
| Sioux | 0.0 /100 | #286 | Tragic 2.5% |
| Hondurans | 0.0 /100 | #287 | Tragic 2.5% |
| French American Indians | 0.0 /100 | #288 | Tragic 2.5% |
| Immigrants | Nonimmigrants | 0.0 /100 | #289 | Tragic 2.5% |
| Immigrants | Cuba | 0.0 /100 | #290 | Tragic 2.5% |
| Immigrants | Honduras | 0.0 /100 | #291 | Tragic 2.5% |
| Crow | 0.0 /100 | #292 | Tragic 2.5% |
| Yaqui | 0.0 /100 | #293 | Tragic 2.5% |
| Ottawa | 0.0 /100 | #294 | Tragic 2.5% |
| Delaware | 0.0 /100 | #295 | Tragic 2.5% |
Demographics Similar to Cheyenne by Vision Disability
In terms of vision disability, the demographic groups most similar to Cheyenne are Cajun (3.1%, a difference of 1.1%), Seminole (3.1%, a difference of 1.1%), Central American Indian (3.0%, a difference of 1.5%), Navajo (3.1%, a difference of 1.7%), and Alaskan Athabascan (3.1%, a difference of 1.8%).
| Demographics | Rating | Rank | Vision Disability |
| Natives/Alaskans | 0.0 /100 | #327 | Tragic 3.0% |
| Yuman | 0.0 /100 | #328 | Tragic 3.0% |
| Apache | 0.0 /100 | #329 | Tragic 3.0% |
| Colville | 0.0 /100 | #330 | Tragic 3.0% |
| Central American Indians | 0.0 /100 | #331 | Tragic 3.0% |
| Seminole | 0.0 /100 | #332 | Tragic 3.1% |
| Cajuns | 0.0 /100 | #333 | Tragic 3.1% |
| Cheyenne | 0.0 /100 | #334 | Tragic 3.1% |
| Navajo | 0.0 /100 | #335 | Tragic 3.1% |
| Alaskan Athabascans | 0.0 /100 | #336 | Tragic 3.1% |
| Dutch West Indians | 0.0 /100 | #337 | Tragic 3.2% |
| Chickasaw | 0.0 /100 | #338 | Tragic 3.2% |
| Tsimshian | 0.0 /100 | #339 | Tragic 3.2% |
| Creek | 0.0 /100 | #340 | Tragic 3.2% |
| Kiowa | 0.0 /100 | #341 | Tragic 3.3% |