Yuman vs Immigrants from Sierra Leone Vision Disability
COMPARE
Yuman
Immigrants from Sierra Leone
Vision Disability
Vision Disability Comparison
Yuman
Immigrants from Sierra Leone
3.0%
VISION DISABILITY
0.0/ 100
METRIC RATING
328th/ 347
METRIC RANK
2.1%
VISION DISABILITY
82.8/ 100
METRIC RATING
143rd/ 347
METRIC RANK
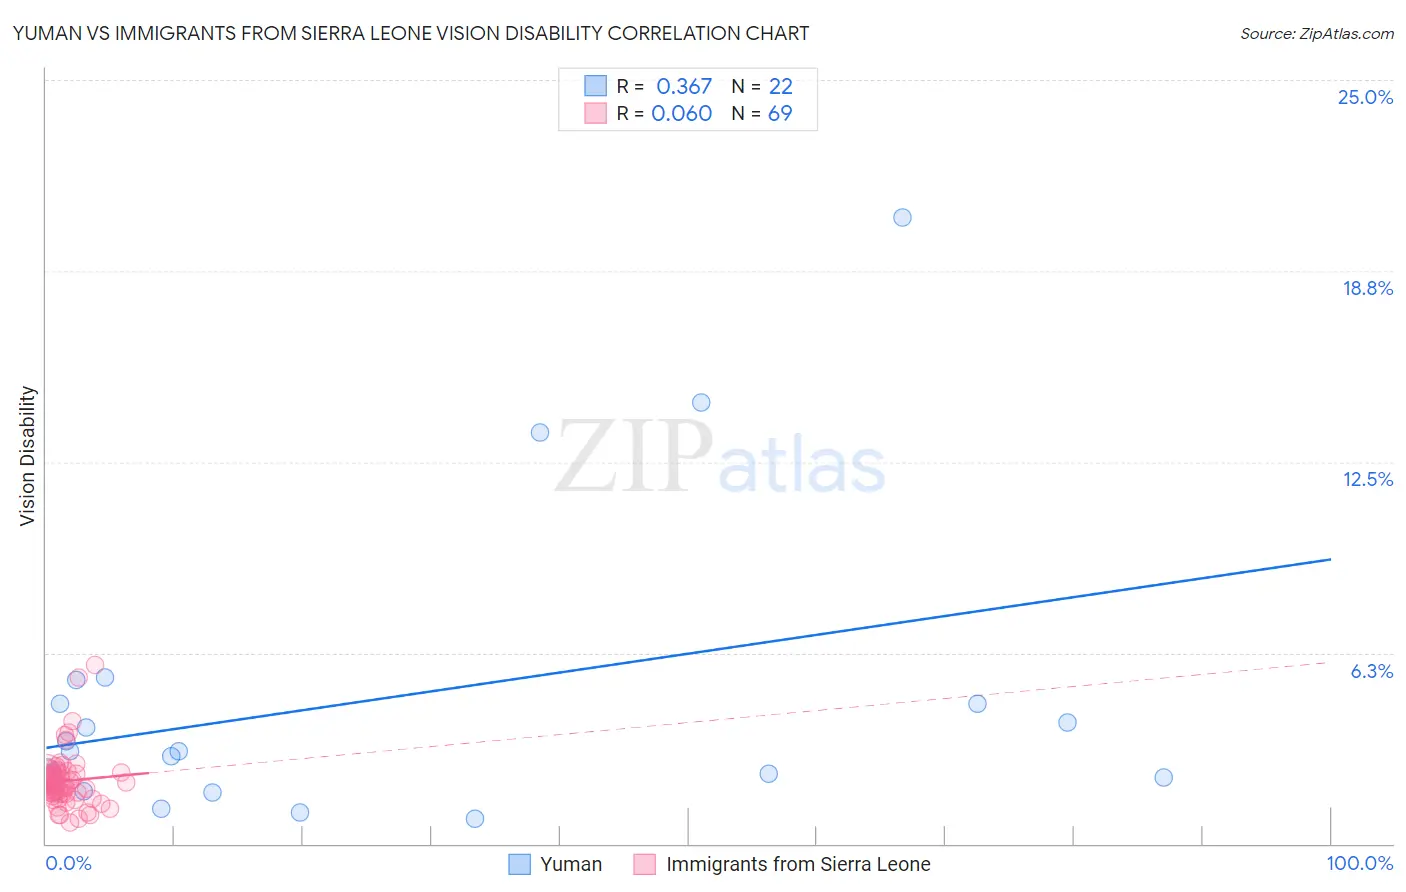
Yuman vs Immigrants from Sierra Leone Vision Disability Correlation Chart
The statistical analysis conducted on geographies consisting of 40,661,627 people shows a mild positive correlation between the proportion of Yuman and percentage of population with vision disability in the United States with a correlation coefficient (R) of 0.367 and weighted average of 3.0%. Similarly, the statistical analysis conducted on geographies consisting of 101,645,799 people shows a slight positive correlation between the proportion of Immigrants from Sierra Leone and percentage of population with vision disability in the United States with a correlation coefficient (R) of 0.060 and weighted average of 2.1%, a difference of 41.3%.
Vision Disability Correlation Summary
| Measurement | Yuman | Immigrants from Sierra Leone |
| Minimum | 0.83% | 0.70% |
| Maximum | 20.5% | 5.8% |
| Range | 19.7% | 5.1% |
| Mean | 4.7% | 2.1% |
| Median | 3.0% | 2.0% |
| Interquartile 25% (IQ1) | 2.2% | 1.6% |
| Interquartile 75% (IQ3) | 4.6% | 2.3% |
| Interquartile Range (IQR) | 2.4% | 0.65% |
| Standard Deviation (Sample) | 5.0% | 0.88% |
| Standard Deviation (Population) | 4.9% | 0.87% |
Similar Demographics by Vision Disability
Demographics Similar to Yuman by Vision Disability
In terms of vision disability, the demographic groups most similar to Yuman are Apache (3.0%, a difference of 0.19%), Native/Alaskan (3.0%, a difference of 0.54%), Spanish American (2.9%, a difference of 1.3%), Colville (3.0%, a difference of 1.4%), and Central American Indian (3.0%, a difference of 2.1%).
| Demographics | Rating | Rank | Vision Disability |
| Comanche | 0.0 /100 | #321 | Tragic 2.8% |
| Paiute | 0.0 /100 | #322 | Tragic 2.9% |
| Tlingit-Haida | 0.0 /100 | #323 | Tragic 2.9% |
| Hopi | 0.0 /100 | #324 | Tragic 2.9% |
| Cherokee | 0.0 /100 | #325 | Tragic 2.9% |
| Spanish Americans | 0.0 /100 | #326 | Tragic 2.9% |
| Natives/Alaskans | 0.0 /100 | #327 | Tragic 3.0% |
| Yuman | 0.0 /100 | #328 | Tragic 3.0% |
| Apache | 0.0 /100 | #329 | Tragic 3.0% |
| Colville | 0.0 /100 | #330 | Tragic 3.0% |
| Central American Indians | 0.0 /100 | #331 | Tragic 3.0% |
| Seminole | 0.0 /100 | #332 | Tragic 3.1% |
| Cajuns | 0.0 /100 | #333 | Tragic 3.1% |
| Cheyenne | 0.0 /100 | #334 | Tragic 3.1% |
| Navajo | 0.0 /100 | #335 | Tragic 3.1% |
Demographics Similar to Immigrants from Sierra Leone by Vision Disability
In terms of vision disability, the demographic groups most similar to Immigrants from Sierra Leone are South American (2.1%, a difference of 0.0%), Ukrainian (2.1%, a difference of 0.11%), Sierra Leonean (2.1%, a difference of 0.15%), Immigrants from Bosnia and Herzegovina (2.1%, a difference of 0.15%), and Immigrants from Netherlands (2.1%, a difference of 0.16%).
| Demographics | Rating | Rank | Vision Disability |
| Czechs | 86.3 /100 | #136 | Excellent 2.1% |
| Immigrants | South Eastern Asia | 86.3 /100 | #137 | Excellent 2.1% |
| Arabs | 86.3 /100 | #138 | Excellent 2.1% |
| Immigrants | Morocco | 85.2 /100 | #139 | Excellent 2.1% |
| Immigrants | Netherlands | 84.2 /100 | #140 | Excellent 2.1% |
| Sierra Leoneans | 84.1 /100 | #141 | Excellent 2.1% |
| South Americans | 82.8 /100 | #142 | Excellent 2.1% |
| Immigrants | Sierra Leone | 82.8 /100 | #143 | Excellent 2.1% |
| Ukrainians | 81.9 /100 | #144 | Excellent 2.1% |
| Immigrants | Bosnia and Herzegovina | 81.5 /100 | #145 | Excellent 2.1% |
| Italians | 79.7 /100 | #146 | Good 2.1% |
| Immigrants | Sudan | 78.4 /100 | #147 | Good 2.1% |
| Finns | 78.3 /100 | #148 | Good 2.1% |
| Colombians | 76.2 /100 | #149 | Good 2.1% |
| Belgians | 75.9 /100 | #150 | Good 2.1% |