Immigrants from Cabo Verde vs Cheyenne Vision Disability
COMPARE
Immigrants from Cabo Verde
Cheyenne
Vision Disability
Vision Disability Comparison
Immigrants from Cabo Verde
Cheyenne
2.6%
VISION DISABILITY
0.0/ 100
METRIC RATING
303rd/ 347
METRIC RANK
3.1%
VISION DISABILITY
0.0/ 100
METRIC RATING
334th/ 347
METRIC RANK
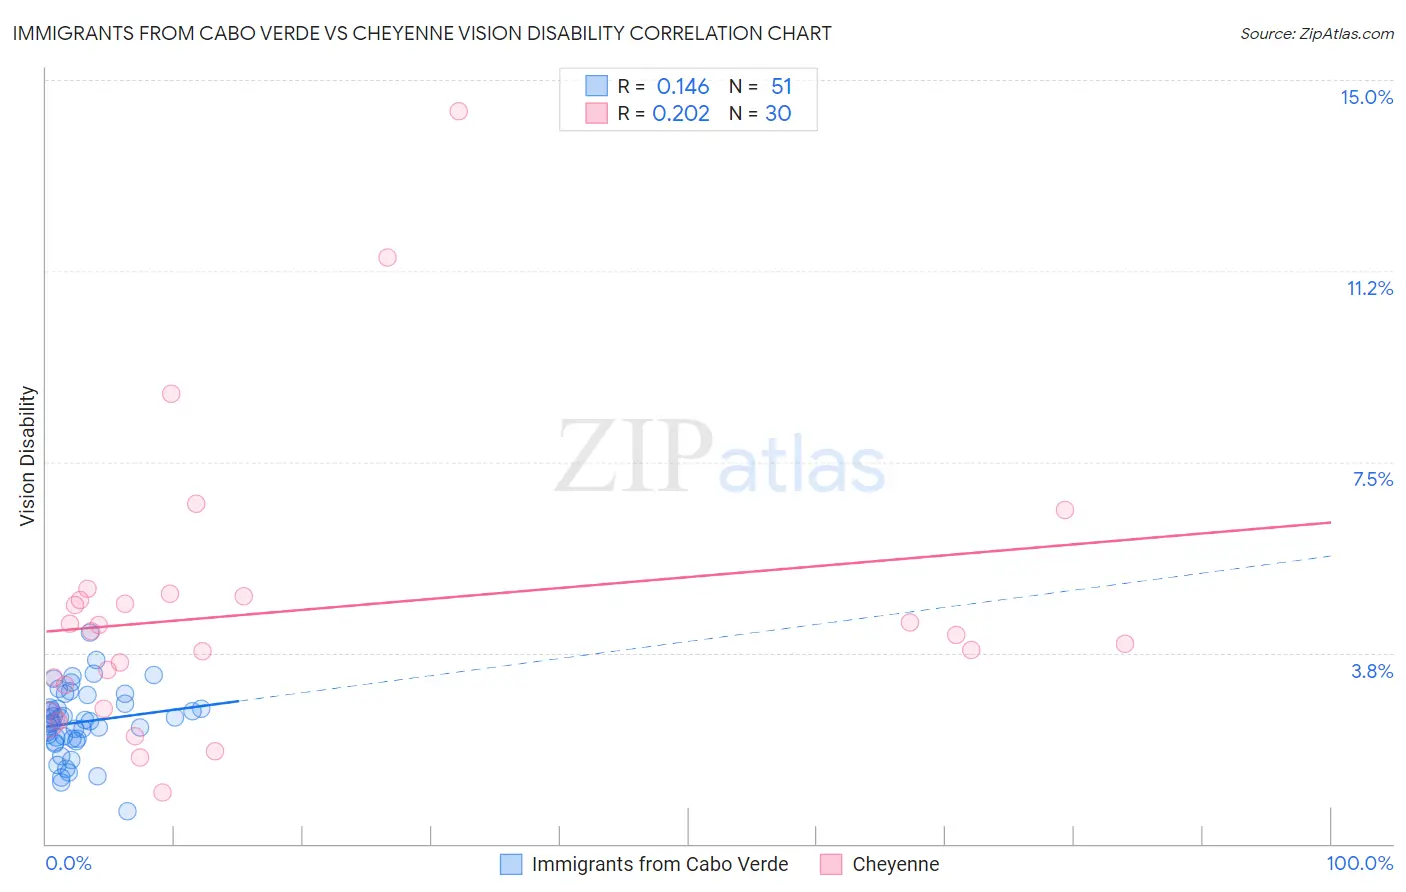
Immigrants from Cabo Verde vs Cheyenne Vision Disability Correlation Chart
The statistical analysis conducted on geographies consisting of 38,135,099 people shows a poor positive correlation between the proportion of Immigrants from Cabo Verde and percentage of population with vision disability in the United States with a correlation coefficient (R) of 0.146 and weighted average of 2.6%. Similarly, the statistical analysis conducted on geographies consisting of 80,705,474 people shows a weak positive correlation between the proportion of Cheyenne and percentage of population with vision disability in the United States with a correlation coefficient (R) of 0.202 and weighted average of 3.1%, a difference of 19.8%.
Vision Disability Correlation Summary
| Measurement | Immigrants from Cabo Verde | Cheyenne |
| Minimum | 0.65% | 1.0% |
| Maximum | 4.1% | 14.4% |
| Range | 3.5% | 13.4% |
| Mean | 2.4% | 4.6% |
| Median | 2.4% | 4.1% |
| Interquartile 25% (IQ1) | 2.1% | 3.1% |
| Interquartile 75% (IQ3) | 2.8% | 4.9% |
| Interquartile Range (IQR) | 0.70% | 1.7% |
| Standard Deviation (Sample) | 0.67% | 2.8% |
| Standard Deviation (Population) | 0.66% | 2.8% |
Similar Demographics by Vision Disability
Demographics Similar to Immigrants from Cabo Verde by Vision Disability
In terms of vision disability, the demographic groups most similar to Immigrants from Cabo Verde are Aleut (2.6%, a difference of 0.13%), Spanish American Indian (2.6%, a difference of 0.22%), Hispanic or Latino (2.6%, a difference of 0.43%), Iroquois (2.6%, a difference of 1.1%), and Immigrants from Dominican Republic (2.6%, a difference of 1.1%).
| Demographics | Rating | Rank | Vision Disability |
| Immigrants | Mexico | 0.0 /100 | #296 | Tragic 2.5% |
| Immigrants | Dominica | 0.0 /100 | #297 | Tragic 2.5% |
| Mexicans | 0.0 /100 | #298 | Tragic 2.5% |
| Cree | 0.0 /100 | #299 | Tragic 2.5% |
| Africans | 0.0 /100 | #300 | Tragic 2.5% |
| Menominee | 0.0 /100 | #301 | Tragic 2.5% |
| Spanish American Indians | 0.0 /100 | #302 | Tragic 2.6% |
| Immigrants | Cabo Verde | 0.0 /100 | #303 | Tragic 2.6% |
| Aleuts | 0.0 /100 | #304 | Tragic 2.6% |
| Hispanics or Latinos | 0.0 /100 | #305 | Tragic 2.6% |
| Iroquois | 0.0 /100 | #306 | Tragic 2.6% |
| Immigrants | Dominican Republic | 0.0 /100 | #307 | Tragic 2.6% |
| Arapaho | 0.0 /100 | #308 | Tragic 2.6% |
| Immigrants | Yemen | 0.0 /100 | #309 | Tragic 2.6% |
| Blackfeet | 0.0 /100 | #310 | Tragic 2.6% |
Demographics Similar to Cheyenne by Vision Disability
In terms of vision disability, the demographic groups most similar to Cheyenne are Cajun (3.1%, a difference of 1.1%), Seminole (3.1%, a difference of 1.1%), Central American Indian (3.0%, a difference of 1.5%), Navajo (3.1%, a difference of 1.7%), and Alaskan Athabascan (3.1%, a difference of 1.8%).
| Demographics | Rating | Rank | Vision Disability |
| Natives/Alaskans | 0.0 /100 | #327 | Tragic 3.0% |
| Yuman | 0.0 /100 | #328 | Tragic 3.0% |
| Apache | 0.0 /100 | #329 | Tragic 3.0% |
| Colville | 0.0 /100 | #330 | Tragic 3.0% |
| Central American Indians | 0.0 /100 | #331 | Tragic 3.0% |
| Seminole | 0.0 /100 | #332 | Tragic 3.1% |
| Cajuns | 0.0 /100 | #333 | Tragic 3.1% |
| Cheyenne | 0.0 /100 | #334 | Tragic 3.1% |
| Navajo | 0.0 /100 | #335 | Tragic 3.1% |
| Alaskan Athabascans | 0.0 /100 | #336 | Tragic 3.1% |
| Dutch West Indians | 0.0 /100 | #337 | Tragic 3.2% |
| Chickasaw | 0.0 /100 | #338 | Tragic 3.2% |
| Tsimshian | 0.0 /100 | #339 | Tragic 3.2% |
| Creek | 0.0 /100 | #340 | Tragic 3.2% |
| Kiowa | 0.0 /100 | #341 | Tragic 3.3% |