Yugoslavian vs Asian Female Disability
COMPARE
Yugoslavian
Asian
Female Disability
Female Disability Comparison
Yugoslavians
Asians
12.6%
FEMALE DISABILITY
3.7/ 100
METRIC RATING
238th/ 347
METRIC RANK
10.9%
FEMALE DISABILITY
100.0/ 100
METRIC RATING
21st/ 347
METRIC RANK
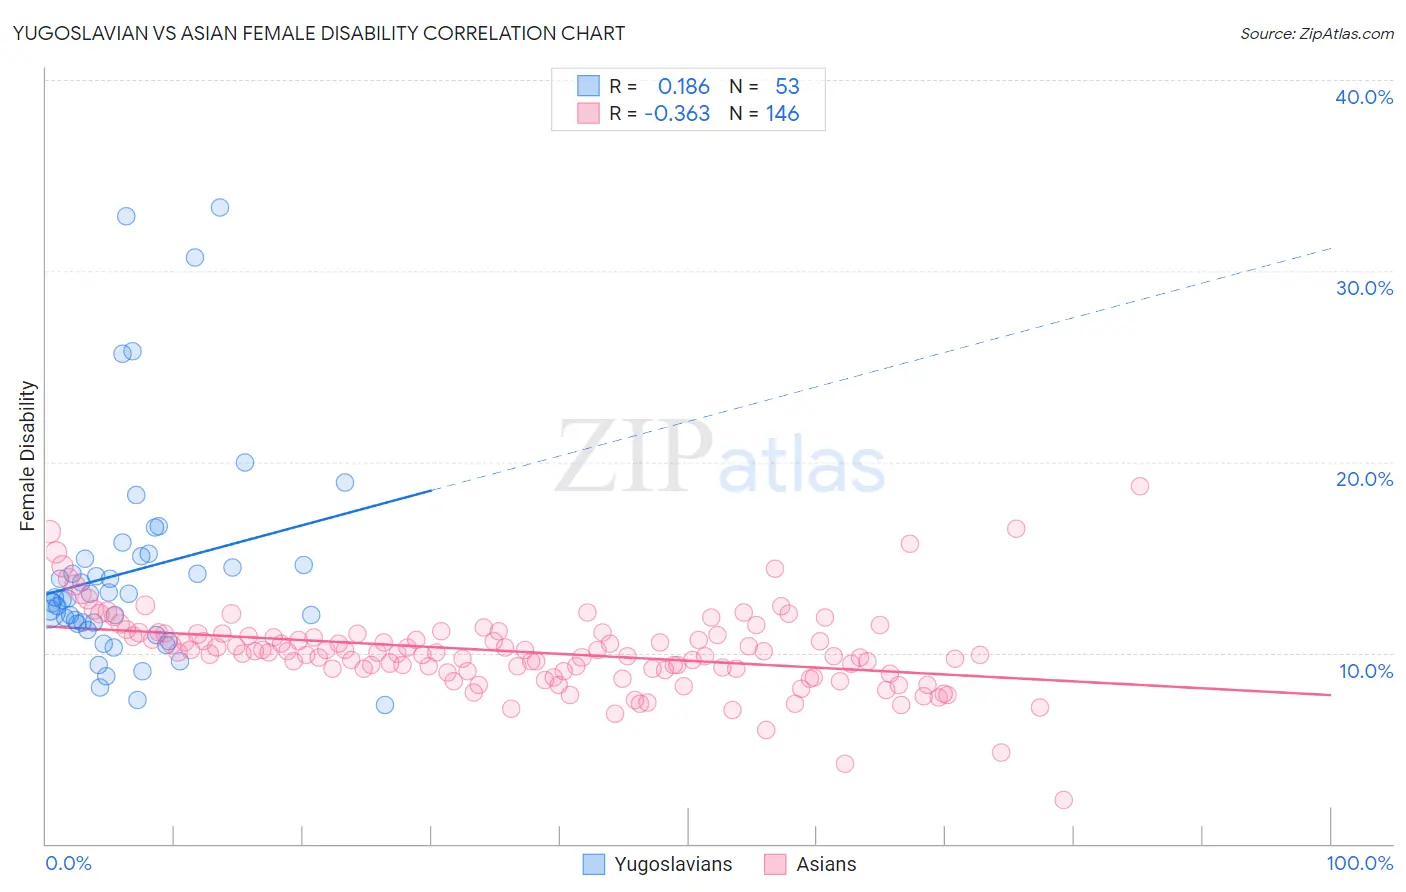
Yugoslavian vs Asian Female Disability Correlation Chart
The statistical analysis conducted on geographies consisting of 285,691,291 people shows a poor positive correlation between the proportion of Yugoslavians and percentage of females with a disability in the United States with a correlation coefficient (R) of 0.186 and weighted average of 12.6%. Similarly, the statistical analysis conducted on geographies consisting of 550,713,500 people shows a mild negative correlation between the proportion of Asians and percentage of females with a disability in the United States with a correlation coefficient (R) of -0.363 and weighted average of 10.9%, a difference of 15.2%.
Female Disability Correlation Summary
| Measurement | Yugoslavian | Asian |
| Minimum | 7.3% | 2.3% |
| Maximum | 33.3% | 18.7% |
| Range | 26.1% | 16.4% |
| Mean | 14.3% | 10.1% |
| Median | 12.9% | 10.0% |
| Interquartile 25% (IQ1) | 11.4% | 9.0% |
| Interquartile 75% (IQ3) | 15.0% | 11.0% |
| Interquartile Range (IQR) | 3.6% | 1.9% |
| Standard Deviation (Sample) | 5.7% | 2.2% |
| Standard Deviation (Population) | 5.7% | 2.1% |
Similar Demographics by Female Disability
Demographics Similar to Yugoslavians by Female Disability
In terms of female disability, the demographic groups most similar to Yugoslavians are Slavic (12.6%, a difference of 0.030%), Barbadian (12.6%, a difference of 0.030%), German Russian (12.6%, a difference of 0.13%), Immigrants from West Indies (12.6%, a difference of 0.15%), and Malaysian (12.5%, a difference of 0.28%).
| Demographics | Rating | Rank | Female Disability |
| Belgians | 6.5 /100 | #231 | Tragic 12.5% |
| Immigrants | Somalia | 5.9 /100 | #232 | Tragic 12.5% |
| Immigrants | Iraq | 5.3 /100 | #233 | Tragic 12.5% |
| Scandinavians | 5.3 /100 | #234 | Tragic 12.5% |
| Malaysians | 5.0 /100 | #235 | Tragic 12.5% |
| Immigrants | West Indies | 4.4 /100 | #236 | Tragic 12.6% |
| Slavs | 3.8 /100 | #237 | Tragic 12.6% |
| Yugoslavians | 3.7 /100 | #238 | Tragic 12.6% |
| Barbadians | 3.6 /100 | #239 | Tragic 12.6% |
| German Russians | 3.2 /100 | #240 | Tragic 12.6% |
| Japanese | 2.7 /100 | #241 | Tragic 12.6% |
| Canadians | 2.6 /100 | #242 | Tragic 12.6% |
| Immigrants | Senegal | 2.5 /100 | #243 | Tragic 12.6% |
| Alsatians | 2.5 /100 | #244 | Tragic 12.6% |
| Immigrants | Jamaica | 2.2 /100 | #245 | Tragic 12.6% |
Demographics Similar to Asians by Female Disability
In terms of female disability, the demographic groups most similar to Asians are Immigrants from Sri Lanka (10.9%, a difference of 0.13%), Venezuelan (11.0%, a difference of 0.35%), Immigrants from Pakistan (10.9%, a difference of 0.36%), Immigrants from Venezuela (10.9%, a difference of 0.54%), and Immigrants from Iran (10.8%, a difference of 0.75%).
| Demographics | Rating | Rank | Female Disability |
| Immigrants | China | 100.0 /100 | #14 | Exceptional 10.7% |
| Burmese | 100.0 /100 | #15 | Exceptional 10.7% |
| Okinawans | 100.0 /100 | #16 | Exceptional 10.8% |
| Indians (Asian) | 100.0 /100 | #17 | Exceptional 10.8% |
| Immigrants | Iran | 100.0 /100 | #18 | Exceptional 10.8% |
| Immigrants | Venezuela | 100.0 /100 | #19 | Exceptional 10.9% |
| Immigrants | Pakistan | 100.0 /100 | #20 | Exceptional 10.9% |
| Asians | 100.0 /100 | #21 | Exceptional 10.9% |
| Immigrants | Sri Lanka | 100.0 /100 | #22 | Exceptional 10.9% |
| Venezuelans | 100.0 /100 | #23 | Exceptional 11.0% |
| Immigrants | Argentina | 100.0 /100 | #24 | Exceptional 11.0% |
| Immigrants | Asia | 100.0 /100 | #25 | Exceptional 11.0% |
| Argentineans | 100.0 /100 | #26 | Exceptional 11.0% |
| Immigrants | Turkey | 100.0 /100 | #27 | Exceptional 11.1% |
| Egyptians | 100.0 /100 | #28 | Exceptional 11.1% |